SPECpower_ssj2008
Aggregate Performance Report
Copyright © 2007-2018 Standard Performance Evaluation Corporation
| Hewlett Packard Enterprise Synergy 480 Gen10 Compute Module | ssj_ops@100% = 34,293,516 ssj_ops@100% per Host = 5,715,586 ssj_ops@100% per JVM = 1,428,897 |
||||
| Test Sponsor: | Hewlett Packard Enterprise | SPEC License #: | 3 | Test Method: | Multi Node |
| Tested By: | Hewlett Packard Enterprise | Test Location: | Houston, TX, USA | Test Date: | Aug 24, 2018 |
| Hardware Availability: | Jun-2018 | Software Availability: | Mar-2018 | Publication: | Sep 12, 2018 |
| System Source: | Single Supplier | System Designation: | Server | Power Provisioning: | Line-powered |
| Target Load | Actual Load | ssj_ops | |
|---|---|---|---|
| Target | Actual | ||
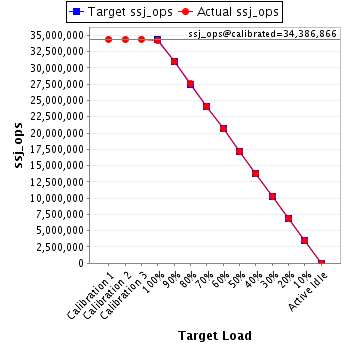
| Calibration 1 | 34,386,219 | ||
| Calibration 2 | 34,351,805 | ||
| Calibration 3 | 34,421,926 | ||
| ssj_ops@calibrated=34,386,866 | |||
| 100% | 99.7% | 34,386,866 | 34,293,516 |
| 90% | 90.0% | 30,948,179 | 30,957,310 |
| 80% | 80.1% | 27,509,493 | 27,541,914 |
| 70% | 70.1% | 24,070,806 | 24,089,287 |
| 60% | 60.0% | 20,632,119 | 20,640,827 |
| 50% | 50.0% | 17,193,433 | 17,186,030 |
| 40% | 40.0% | 13,754,746 | 13,752,456 |
| 30% | 30.0% | 10,316,060 | 10,319,869 |
| 20% | 20.0% | 6,877,373 | 6,878,671 |
| 10% | 10.0% | 3,438,687 | 3,442,543 |
| Active Idle | 0 | 0 | |
| # of Nodes | # of Chips | # of Cores | # of Threads | Total RAM (GB) | # of OS Images | # of JVM Instances |
|---|---|---|---|---|---|---|
| 6 | 12 | 336 | 672 | 1,152 | 6 | 24 |
| Set Identifier: | SUT |
| Set Description: | System Under Test |
| # of Identical Nodes: | 6 |
| Comment: | SUT |
| Hardware per Node | |
|---|---|
| Hardware Vendor: | Hewlett Packard Enterprise |
| Model: | Synergy 480 Gen10 Compute Module |
| Form Factor: | Other |
| CPU Name: | Intel Xeon Platinum 8180 2.50GHz |
| CPU Characteristics: | 28-Core, 2.50 GHz, 38.5 MB L3 Cache |
| CPU Frequency (MHz): | 2500 |
| CPU(s) Enabled: | 56 cores, 2 chips, 28 cores/chip |
| Hardware Threads: | 112 (2 / core) |
| CPU(s) Orderable: | 1,2 chips |
| Primary Cache: | 32 KB I + 32 KB D on chip per core |
| Secondary Cache: | 1 MB I+D on chip per core |
| Tertiary Cache: | 39424 KB I+D on chip per chip |
| Other Cache: | None |
| Memory Amount (GB): | 192 |
| # and size of DIMM: | 12 x 16384 MB |
| Memory Details: | 12 x 16GB 2Rx8 PC4-2666-V ECC; slots 1, 3, 5, 8, 10 and 12 populated on each CPU socket |
| Power Supply Quantity and Rating (W): | None |
| Power Supply Details: | Shared |
| Disk Drive: | 1 x HPE Synergy 480 Gen10 M.2 FIO Adapter Board Kit (873165-B21); 1 x HPE 480GB SATA 6G Read Intensive M.2 2280 SSD (875498-B21) |
| Disk Controller: | 1 x HPE Smart Array S100i SR Gen10 |
| # and type of Network Interface Cards (NICs) Installed: | 1 x HPE Synergy 3820C 10/20Gb 2-port Converged Network Adapter (777430-B21) |
| NICs Enabled in Firmware / OS / Connected: | 2/1/1 |
| Network Speed (Mbit): | 10000 |
| Keyboard: | None |
| Mouse: | None |
| Monitor: | None |
| Optical Drives: | No |
| Other Hardware: | None |
| Software per Node | |
|---|---|
| Power Management: | Enabled (see SUT Notes) |
| Operating System (OS): | Windows Server 2012 R2 Datacenter |
| OS Version: | 6.3 (Build 9600) |
| Filesystem: | NTFS |
| JVM Vendor: | Oracle Corporation |
| JVM Version: | Java HotSpot(TM) 64-Bit Server VM (build 24.80-b11, mixed mode), version 1.7.0_80 |
| JVM Command-line Options: | -server -Xmn19g -Xms21g -Xmx21g -XX:SurvivorRatio=1 -XX:TargetSurvivorRatio=99 -XX:ParallelGCThreads=28 -XX:AllocatePrefetchDistance=256 -XX:AllocatePrefetchLines=4 -XX:LoopUnrollLimit=45 -XX:InitialTenuringThreshold=12 -XX:MaxTenuringThreshold=15 -XX:InlineSmallCode=9000 -XX:MaxInlineSize=270 -XX:FreqInlineSize=6000 -XX:+UseLargePages -XX:+UseParallelOldGC -XX:+AggressiveOpts |
| JVM Affinity: | start /NODE [0,1,2,3] /AFFINITY [0xFFFFFFF] |
| JVM Instances: | 4 |
| JVM Initial Heap (MB): | 21000 |
| JVM Maximum Heap (MB): | 21000 |
| JVM Address Bits: | 64 |
| Boot Firmware Version: | I42 v1.32 (02/01/2018) |
| Management Firmware Version: | 1.15 Aug 17 2017 |
| Workload Version: | SSJ 1.2.10 |
| Director Location: | Controller |
| Other Software: | HPE Composer Version 3.10.07 (HPE OneView) with HPE Synergy Custom SPP Bundle 2017.10.20180323; Microsoft Windows KB4054519, KB4056898 |
| Host | ssj_ops@100% |
|---|---|
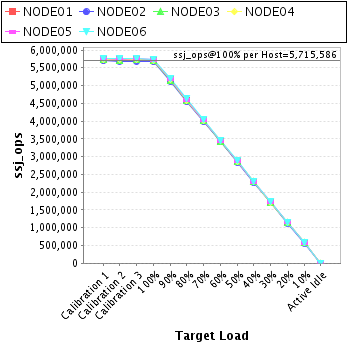
| NODE01 | 5,716,260 |
| NODE02 | 5,669,432 |
| NODE03 | 5,712,933 |
| NODE04 | 5,718,453 |
| NODE05 | 5,731,599 |
| NODE06 | 5,744,838 |
| ssj_ops@100% | 34,293,516 |
| ssj_ops@100% per Host | 5,715,586 |
| ssj_ops@100% per JVM | 1,428,897 |
| Target Load | Actual Load | ssj_ops | |
|---|---|---|---|
| Target | Actual | ||
| Calibration 1 | 5,723,279 | ||
| Calibration 2 | 5,724,033 | ||
| Calibration 3 | 5,738,205 | ||
| ssj_ops@calibrated=5,731,119 | |||
| 100% | 99.7% | 5,731,119 | 5,716,260 |
| 90% | 90.2% | 5,158,007 | 5,167,950 |
| 80% | 80.0% | 4,584,895 | 4,586,668 |
| 70% | 70.1% | 4,011,783 | 4,019,028 |
| 60% | 60.0% | 3,438,671 | 3,436,834 |
| 50% | 49.9% | 2,865,559 | 2,860,132 |
| 40% | 40.0% | 2,292,447 | 2,293,509 |
| 30% | 30.0% | 1,719,336 | 1,721,712 |
| 20% | 20.0% | 1,146,224 | 1,146,294 |
| 10% | 10.0% | 573,112 | 573,876 |
| Active Idle | 0 | 0 | |

| Target Load | Actual Load | ssj_ops | |
|---|---|---|---|
| Target | Actual | ||
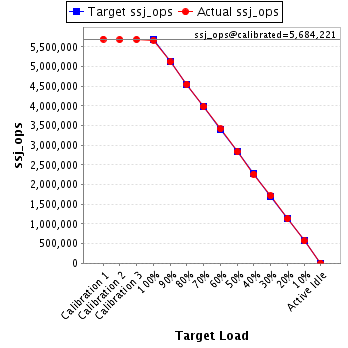
| Calibration 1 | 5,694,773 | ||
| Calibration 2 | 5,682,334 | ||
| Calibration 3 | 5,686,107 | ||
| ssj_ops@calibrated=5,684,221 | |||
| 100% | 99.7% | 5,684,221 | 5,669,432 |
| 90% | 90.0% | 5,115,799 | 5,116,728 |
| 80% | 80.0% | 4,547,377 | 4,546,937 |
| 70% | 70.1% | 3,978,954 | 3,984,686 |
| 60% | 60.0% | 3,410,532 | 3,411,998 |
| 50% | 49.9% | 2,842,110 | 2,835,074 |
| 40% | 39.9% | 2,273,688 | 2,266,360 |
| 30% | 30.1% | 1,705,266 | 1,709,403 |
| 20% | 19.9% | 1,136,844 | 1,132,556 |
| 10% | 10.0% | 568,422 | 569,045 |
| Active Idle | 0 | 0 | |
| Target Load | Actual Load | ssj_ops | |
|---|---|---|---|
| Target | Actual | ||
| Calibration 1 | 5,723,470 | ||
| Calibration 2 | 5,716,252 | ||
| Calibration 3 | 5,732,333 | ||
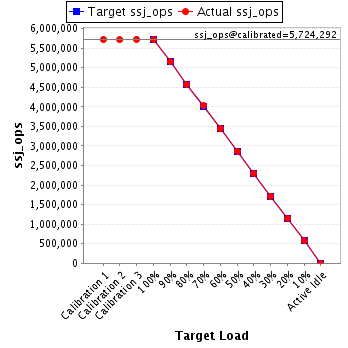
| ssj_ops@calibrated=5,724,292 | |||
| 100% | 99.8% | 5,724,292 | 5,712,933 |
| 90% | 90.0% | 5,151,863 | 5,153,686 |
| 80% | 79.9% | 4,579,434 | 4,571,971 |
| 70% | 70.3% | 4,007,004 | 4,023,022 |
| 60% | 60.1% | 3,434,575 | 3,439,634 |
| 50% | 50.0% | 2,862,146 | 2,863,888 |
| 40% | 40.0% | 2,289,717 | 2,292,252 |
| 30% | 30.0% | 1,717,288 | 1,715,248 |
| 20% | 20.0% | 1,144,858 | 1,147,189 |
| 10% | 10.0% | 572,429 | 574,424 |
| Active Idle | 0 | 0 | |
| Target Load | Actual Load | ssj_ops | |
|---|---|---|---|
| Target | Actual | ||
| Calibration 1 | 5,730,031 | ||
| Calibration 2 | 5,727,340 | ||
| Calibration 3 | 5,739,565 | ||
| ssj_ops@calibrated=5,733,452 | |||
| 100% | 99.7% | 5,733,452 | 5,718,453 |
| 90% | 90.0% | 5,160,107 | 5,159,938 |
| 80% | 80.1% | 4,586,762 | 4,589,754 |
| 70% | 69.9% | 4,013,416 | 4,007,421 |
| 60% | 60.1% | 3,440,071 | 3,443,460 |
| 50% | 50.0% | 2,866,726 | 2,866,696 |
| 40% | 40.1% | 2,293,381 | 2,296,602 |
| 30% | 30.0% | 1,720,036 | 1,718,513 |
| 20% | 20.0% | 1,146,690 | 1,147,590 |
| 10% | 10.0% | 573,345 | 573,181 |
| Active Idle | 0 | 0 | |

| Target Load | Actual Load | ssj_ops | |
|---|---|---|---|
| Target | Actual | ||
| Calibration 1 | 5,753,216 | ||
| Calibration 2 | 5,743,809 | ||
| Calibration 3 | 5,755,431 | ||
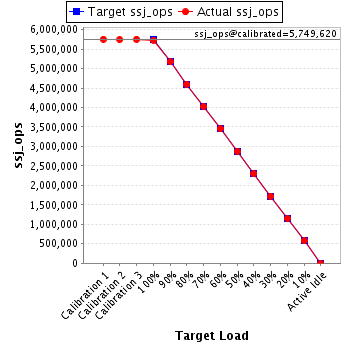
| ssj_ops@calibrated=5,749,620 | |||
| 100% | 99.7% | 5,749,620 | 5,731,599 |
| 90% | 90.0% | 5,174,658 | 5,172,363 |
| 80% | 80.0% | 4,599,696 | 4,599,736 |
| 70% | 70.0% | 4,024,734 | 4,022,979 |
| 60% | 60.0% | 3,449,772 | 3,451,258 |
| 50% | 50.0% | 2,874,810 | 2,874,815 |
| 40% | 39.9% | 2,299,848 | 2,294,940 |
| 30% | 30.0% | 1,724,886 | 1,726,902 |
| 20% | 20.0% | 1,149,924 | 1,150,083 |
| 10% | 10.0% | 574,962 | 576,037 |
| Active Idle | 0 | 0 | |
| Target Load | Actual Load | ssj_ops | |
|---|---|---|---|
| Target | Actual | ||
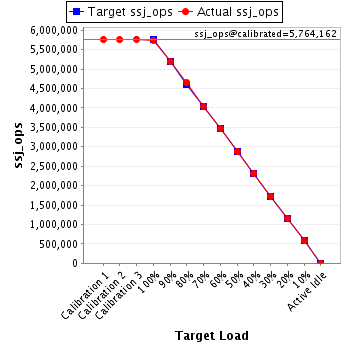
| Calibration 1 | 5,761,450 | ||
| Calibration 2 | 5,758,038 | ||
| Calibration 3 | 5,770,286 | ||
| ssj_ops@calibrated=5,764,162 | |||
| 100% | 99.7% | 5,764,162 | 5,744,838 |
| 90% | 90.0% | 5,187,746 | 5,186,644 |
| 80% | 80.6% | 4,611,330 | 4,646,848 |
| 70% | 70.0% | 4,034,914 | 4,032,153 |
| 60% | 60.0% | 3,458,497 | 3,457,642 |
| 50% | 50.1% | 2,882,081 | 2,885,425 |
| 40% | 40.1% | 2,305,665 | 2,308,793 |
| 30% | 30.0% | 1,729,249 | 1,728,090 |
| 20% | 20.0% | 1,152,832 | 1,154,959 |
| 10% | 10.0% | 576,416 | 575,980 |
| Active Idle | 0 | 0 | |