SPECpower_ssj2008
Host 'NODE04' Performance Report
Copyright © 2007-2018 Standard Performance Evaluation Corporation
| Hewlett Packard Enterprise Synergy 480 Gen10 Compute Module | ssj_ops@100% = 5,718,453 ssj_ops@100% per JVM = 1,429,613 |
||||
| Test Sponsor: | Hewlett Packard Enterprise | SPEC License #: | 3 | Test Method: | Multi Node |
| Tested By: | Hewlett Packard Enterprise | Test Location: | Houston, TX, USA | Test Date: | Aug 24, 2018 |
| Hardware Availability: | Jun-2018 | Software Availability: | Mar-2018 | Publication: | Sep 12, 2018 |
| System Source: | Single Supplier | System Designation: | Server | Power Provisioning: | Line-powered |
| Target Load | Actual Load | ssj_ops | |
|---|---|---|---|
| Target | Actual | ||
| Calibration 1 | 5,730,031 | ||
| Calibration 2 | 5,727,340 | ||
| Calibration 3 | 5,739,565 | ||
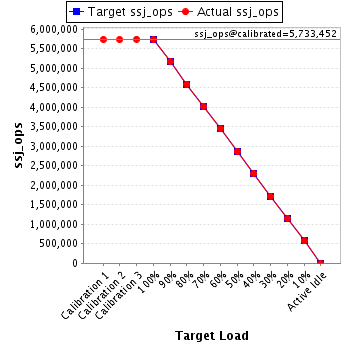
| ssj_ops@calibrated=5,733,452 | |||
| 100% | 99.7% | 5,733,452 | 5,718,453 |
| 90% | 90.0% | 5,160,107 | 5,159,938 |
| 80% | 80.1% | 4,586,762 | 4,589,754 |
| 70% | 69.9% | 4,013,416 | 4,007,421 |
| 60% | 60.1% | 3,440,071 | 3,443,460 |
| 50% | 50.0% | 2,866,726 | 2,866,696 |
| 40% | 40.1% | 2,293,381 | 2,296,602 |
| 30% | 30.0% | 1,720,036 | 1,718,513 |
| 20% | 20.0% | 1,146,690 | 1,147,590 |
| 10% | 10.0% | 573,345 | 573,181 |
| Active Idle | 0 | 0 | |
| Set Identifier: | SUT |
| Set Description: | System Under Test |
| # of Identical Nodes: | 6 |
| Comment: | SUT |
| Hardware | |
|---|---|
| Hardware Vendor: | Hewlett Packard Enterprise |
| Model: | Synergy 480 Gen10 Compute Module |
| Form Factor: | Other |
| CPU Name: | Intel Xeon Platinum 8180 2.50GHz |
| CPU Characteristics: | 28-Core, 2.50 GHz, 38.5 MB L3 Cache |
| CPU Frequency (MHz): | 2500 |
| CPU(s) Enabled: | 56 cores, 2 chips, 28 cores/chip |
| Hardware Threads: | 112 (2 / core) |
| CPU(s) Orderable: | 1,2 chips |
| Primary Cache: | 32 KB I + 32 KB D on chip per core |
| Secondary Cache: | 1 MB I+D on chip per core |
| Tertiary Cache: | 39424 KB I+D on chip per chip |
| Other Cache: | None |
| Memory Amount (GB): | 192 |
| # and size of DIMM: | 12 x 16384 MB |
| Memory Details: | 12 x 16GB 2Rx8 PC4-2666-V ECC; slots 1, 3, 5, 8, 10 and 12 populated on each CPU socket |
| Power Supply Quantity and Rating (W): | None |
| Power Supply Details: | Shared |
| Disk Drive: | 1 x HPE Synergy 480 Gen10 M.2 FIO Adapter Board Kit (873165-B21); 1 x HPE 480GB SATA 6G Read Intensive M.2 2280 SSD (875498-B21) |
| Disk Controller: | 1 x HPE Smart Array S100i SR Gen10 |
| # and type of Network Interface Cards (NICs) Installed: | 1 x HPE Synergy 3820C 10/20Gb 2-port Converged Network Adapter (777430-B21) |
| NICs Enabled in Firmware / OS / Connected: | 2/1/1 |
| Network Speed (Mbit): | 10000 |
| Keyboard: | None |
| Mouse: | None |
| Monitor: | None |
| Optical Drives: | No |
| Other Hardware: | None |
| Software | |
|---|---|
| Power Management: | Enabled (see SUT Notes) |
| Operating System (OS): | Windows Server 2012 R2 Datacenter |
| OS Version: | 6.3 (Build 9600) |
| Filesystem: | NTFS |
| JVM Vendor: | Oracle Corporation |
| JVM Version: | Java HotSpot(TM) 64-Bit Server VM (build 24.80-b11, mixed mode), version 1.7.0_80 |
| JVM Command-line Options: | -server -Xmn19g -Xms21g -Xmx21g -XX:SurvivorRatio=1 -XX:TargetSurvivorRatio=99 -XX:ParallelGCThreads=28 -XX:AllocatePrefetchDistance=256 -XX:AllocatePrefetchLines=4 -XX:LoopUnrollLimit=45 -XX:InitialTenuringThreshold=12 -XX:MaxTenuringThreshold=15 -XX:InlineSmallCode=9000 -XX:MaxInlineSize=270 -XX:FreqInlineSize=6000 -XX:+UseLargePages -XX:+UseParallelOldGC -XX:+AggressiveOpts |
| JVM Affinity: | start /NODE [0,1,2,3] /AFFINITY [0xFFFFFFF] |
| JVM Instances: | 4 |
| JVM Initial Heap (MB): | 21000 |
| JVM Maximum Heap (MB): | 21000 |
| JVM Address Bits: | 64 |
| Boot Firmware Version: | I42 v1.32 (02/01/2018) |
| Management Firmware Version: | 1.15 Aug 17 2017 |
| Workload Version: | SSJ 1.2.10 |
| Director Location: | Controller |
| Other Software: | HPE Composer Version 3.10.07 (HPE OneView) with HPE Synergy Custom SPP Bundle 2017.10.20180323; Microsoft Windows KB4054519, KB4056898 |
| JVM Instance | ssj_ops@100% |
|---|---|
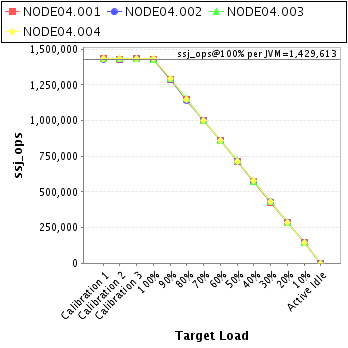
| NODE04.001 | 1,426,995 |
| NODE04.002 | 1,426,271 |
| NODE04.003 | 1,431,520 |
| NODE04.004 | 1,433,667 |
| ssj_ops@100% | 5,718,453 |
| ssj_ops@100% per JVM | 1,429,613 |
| Target Load | Actual Load | ssj_ops | |
|---|---|---|---|
| Target | Actual | ||
| Calibration 1 | 1,432,496 | ||
| Calibration 2 | 1,430,226 | ||
| Calibration 3 | 1,434,115 | ||
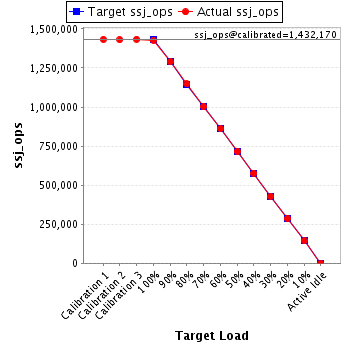
| ssj_ops@calibrated=1,432,170 | |||
| 100% | 99.6% | 1,432,170 | 1,426,995 |
| 90% | 90.0% | 1,288,953 | 1,289,066 |
| 80% | 80.1% | 1,145,736 | 1,147,560 |
| 70% | 70.0% | 1,002,519 | 1,002,314 |
| 60% | 60.1% | 859,302 | 860,626 |
| 50% | 50.0% | 716,085 | 715,567 |
| 40% | 40.2% | 572,868 | 575,901 |
| 30% | 29.9% | 429,651 | 428,476 |
| 20% | 20.0% | 286,434 | 285,736 |
| 10% | 10.0% | 143,217 | 143,022 |
| Active Idle | 0 | 0 | |
| Target Load | Actual Load | ssj_ops | |
|---|---|---|---|
| Target | Actual | ||
| Calibration 1 | 1,431,191 | ||
| Calibration 2 | 1,428,285 | ||
| Calibration 3 | 1,432,847 | ||
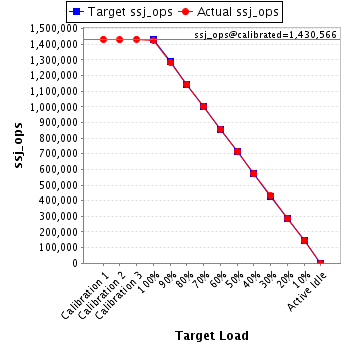
| ssj_ops@calibrated=1,430,566 | |||
| 100% | 99.7% | 1,430,566 | 1,426,271 |
| 90% | 89.9% | 1,287,509 | 1,286,080 |
| 80% | 80.0% | 1,144,453 | 1,144,202 |
| 70% | 70.1% | 1,001,396 | 1,002,468 |
| 60% | 59.9% | 858,340 | 857,516 |
| 50% | 50.0% | 715,283 | 715,573 |
| 40% | 39.9% | 572,226 | 570,870 |
| 30% | 30.1% | 429,170 | 430,194 |
| 20% | 20.1% | 286,113 | 287,082 |
| 10% | 10.1% | 143,057 | 143,940 |
| Active Idle | 0 | 0 | |
| Target Load | Actual Load | ssj_ops | |
|---|---|---|---|
| Target | Actual | ||
| Calibration 1 | 1,433,450 | ||
| Calibration 2 | 1,433,786 | ||
| Calibration 3 | 1,437,740 | ||
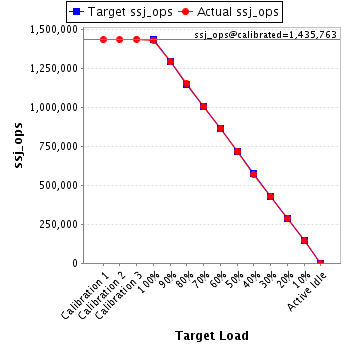
| ssj_ops@calibrated=1,435,763 | |||
| 100% | 99.7% | 1,435,763 | 1,431,520 |
| 90% | 90.0% | 1,292,187 | 1,291,924 |
| 80% | 80.2% | 1,148,610 | 1,151,633 |
| 70% | 69.9% | 1,005,034 | 1,003,939 |
| 60% | 60.0% | 861,458 | 862,067 |
| 50% | 50.1% | 717,882 | 718,786 |
| 40% | 39.9% | 574,305 | 572,340 |
| 30% | 30.0% | 430,729 | 430,055 |
| 20% | 19.9% | 287,153 | 286,324 |
| 10% | 10.0% | 143,576 | 143,438 |
| Active Idle | 0 | 0 | |
| Target Load | Actual Load | ssj_ops | |
|---|---|---|---|
| Target | Actual | ||
| Calibration 1 | 1,432,894 | ||
| Calibration 2 | 1,435,043 | ||
| Calibration 3 | 1,434,862 | ||
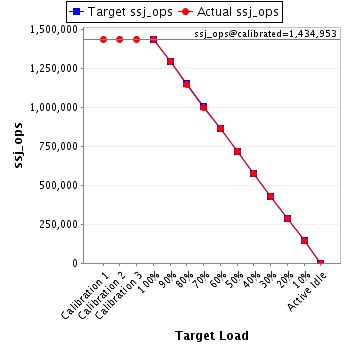
| ssj_ops@calibrated=1,434,953 | |||
| 100% | 99.9% | 1,434,953 | 1,433,667 |
| 90% | 90.1% | 1,291,457 | 1,292,869 |
| 80% | 79.9% | 1,147,962 | 1,146,359 |
| 70% | 69.6% | 1,004,467 | 998,699 |
| 60% | 60.2% | 860,972 | 863,251 |
| 50% | 50.0% | 717,476 | 716,771 |
| 40% | 40.2% | 573,981 | 577,491 |
| 30% | 30.0% | 430,486 | 429,788 |
| 20% | 20.1% | 286,991 | 288,448 |
| 10% | 10.0% | 143,495 | 142,781 |
| Active Idle | 0 | 0 | |