SPECpower_ssj2008
Host 'NODE03' Performance Report
Copyright © 2007-2018 Standard Performance Evaluation Corporation
| Hewlett Packard Enterprise Synergy 480 Gen10 Compute Module | ssj_ops@100% = 5,712,933 ssj_ops@100% per JVM = 1,428,233 |
||||
| Test Sponsor: | Hewlett Packard Enterprise | SPEC License #: | 3 | Test Method: | Multi Node |
| Tested By: | Hewlett Packard Enterprise | Test Location: | Houston, TX, USA | Test Date: | Aug 24, 2018 |
| Hardware Availability: | Jun-2018 | Software Availability: | Mar-2018 | Publication: | Sep 12, 2018 |
| System Source: | Single Supplier | System Designation: | Server | Power Provisioning: | Line-powered |
| Target Load | Actual Load | ssj_ops | |
|---|---|---|---|
| Target | Actual | ||
| Calibration 1 | 5,723,470 | ||
| Calibration 2 | 5,716,252 | ||
| Calibration 3 | 5,732,333 | ||
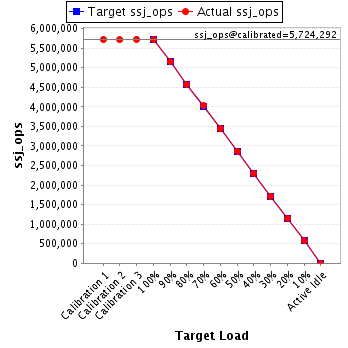
| ssj_ops@calibrated=5,724,292 | |||
| 100% | 99.8% | 5,724,292 | 5,712,933 |
| 90% | 90.0% | 5,151,863 | 5,153,686 |
| 80% | 79.9% | 4,579,434 | 4,571,971 |
| 70% | 70.3% | 4,007,004 | 4,023,022 |
| 60% | 60.1% | 3,434,575 | 3,439,634 |
| 50% | 50.0% | 2,862,146 | 2,863,888 |
| 40% | 40.0% | 2,289,717 | 2,292,252 |
| 30% | 30.0% | 1,717,288 | 1,715,248 |
| 20% | 20.0% | 1,144,858 | 1,147,189 |
| 10% | 10.0% | 572,429 | 574,424 |
| Active Idle | 0 | 0 | |
| Set Identifier: | SUT |
| Set Description: | System Under Test |
| # of Identical Nodes: | 6 |
| Comment: | SUT |
| Hardware | |
|---|---|
| Hardware Vendor: | Hewlett Packard Enterprise |
| Model: | Synergy 480 Gen10 Compute Module |
| Form Factor: | Other |
| CPU Name: | Intel Xeon Platinum 8180 2.50GHz |
| CPU Characteristics: | 28-Core, 2.50 GHz, 38.5 MB L3 Cache |
| CPU Frequency (MHz): | 2500 |
| CPU(s) Enabled: | 56 cores, 2 chips, 28 cores/chip |
| Hardware Threads: | 112 (2 / core) |
| CPU(s) Orderable: | 1,2 chips |
| Primary Cache: | 32 KB I + 32 KB D on chip per core |
| Secondary Cache: | 1 MB I+D on chip per core |
| Tertiary Cache: | 39424 KB I+D on chip per chip |
| Other Cache: | None |
| Memory Amount (GB): | 192 |
| # and size of DIMM: | 12 x 16384 MB |
| Memory Details: | 12 x 16GB 2Rx8 PC4-2666-V ECC; slots 1, 3, 5, 8, 10 and 12 populated on each CPU socket |
| Power Supply Quantity and Rating (W): | None |
| Power Supply Details: | Shared |
| Disk Drive: | 1 x HPE Synergy 480 Gen10 M.2 FIO Adapter Board Kit (873165-B21); 1 x HPE 480GB SATA 6G Read Intensive M.2 2280 SSD (875498-B21) |
| Disk Controller: | 1 x HPE Smart Array S100i SR Gen10 |
| # and type of Network Interface Cards (NICs) Installed: | 1 x HPE Synergy 3820C 10/20Gb 2-port Converged Network Adapter (777430-B21) |
| NICs Enabled in Firmware / OS / Connected: | 2/1/1 |
| Network Speed (Mbit): | 10000 |
| Keyboard: | None |
| Mouse: | None |
| Monitor: | None |
| Optical Drives: | No |
| Other Hardware: | None |
| Software | |
|---|---|
| Power Management: | Enabled (see SUT Notes) |
| Operating System (OS): | Windows Server 2012 R2 Datacenter |
| OS Version: | 6.3 (Build 9600) |
| Filesystem: | NTFS |
| JVM Vendor: | Oracle Corporation |
| JVM Version: | Java HotSpot(TM) 64-Bit Server VM (build 24.80-b11, mixed mode), version 1.7.0_80 |
| JVM Command-line Options: | -server -Xmn19g -Xms21g -Xmx21g -XX:SurvivorRatio=1 -XX:TargetSurvivorRatio=99 -XX:ParallelGCThreads=28 -XX:AllocatePrefetchDistance=256 -XX:AllocatePrefetchLines=4 -XX:LoopUnrollLimit=45 -XX:InitialTenuringThreshold=12 -XX:MaxTenuringThreshold=15 -XX:InlineSmallCode=9000 -XX:MaxInlineSize=270 -XX:FreqInlineSize=6000 -XX:+UseLargePages -XX:+UseParallelOldGC -XX:+AggressiveOpts |
| JVM Affinity: | start /NODE [0,1,2,3] /AFFINITY [0xFFFFFFF] |
| JVM Instances: | 4 |
| JVM Initial Heap (MB): | 21000 |
| JVM Maximum Heap (MB): | 21000 |
| JVM Address Bits: | 64 |
| Boot Firmware Version: | I42 v1.32 (02/01/2018) |
| Management Firmware Version: | 1.15 Aug 17 2017 |
| Workload Version: | SSJ 1.2.10 |
| Director Location: | Controller |
| Other Software: | HPE Composer Version 3.10.07 (HPE OneView) with HPE Synergy Custom SPP Bundle 2017.10.20180323; Microsoft Windows KB4054519, KB4056898 |
| JVM Instance | ssj_ops@100% |
|---|---|
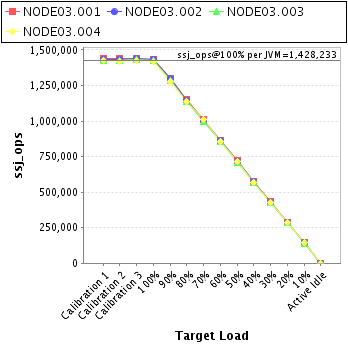
| NODE03.001 | 1,435,182 |
| NODE03.002 | 1,434,841 |
| NODE03.003 | 1,424,627 |
| NODE03.004 | 1,418,283 |
| ssj_ops@100% | 5,712,933 |
| ssj_ops@100% per JVM | 1,428,233 |
| Target Load | Actual Load | ssj_ops | |
|---|---|---|---|
| Target | Actual | ||
| Calibration 1 | 1,437,345 | ||
| Calibration 2 | 1,437,263 | ||
| Calibration 3 | 1,441,965 | ||
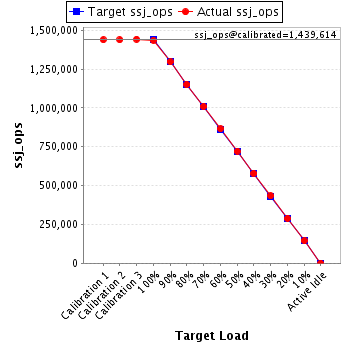
| ssj_ops@calibrated=1,439,614 | |||
| 100% | 99.7% | 1,439,614 | 1,435,182 |
| 90% | 90.0% | 1,295,652 | 1,296,109 |
| 80% | 79.9% | 1,151,691 | 1,149,875 |
| 70% | 70.1% | 1,007,730 | 1,009,706 |
| 60% | 60.1% | 863,768 | 865,058 |
| 50% | 50.1% | 719,807 | 721,269 |
| 40% | 40.1% | 575,846 | 577,795 |
| 30% | 30.1% | 431,884 | 432,836 |
| 20% | 20.0% | 287,923 | 288,587 |
| 10% | 10.1% | 143,961 | 144,722 |
| Active Idle | 0 | 0 | |
| Target Load | Actual Load | ssj_ops | |
|---|---|---|---|
| Target | Actual | ||
| Calibration 1 | 1,433,634 | ||
| Calibration 2 | 1,434,487 | ||
| Calibration 3 | 1,436,625 | ||
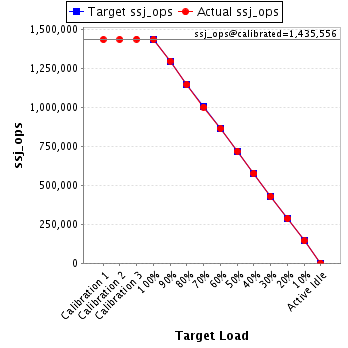
| ssj_ops@calibrated=1,435,556 | |||
| 100% | 100.0% | 1,435,556 | 1,434,841 |
| 90% | 90.3% | 1,292,001 | 1,296,267 |
| 80% | 79.8% | 1,148,445 | 1,145,163 |
| 70% | 69.8% | 1,004,889 | 1,001,696 |
| 60% | 60.1% | 861,334 | 862,980 |
| 50% | 50.0% | 717,778 | 718,177 |
| 40% | 40.1% | 574,222 | 575,020 |
| 30% | 29.9% | 430,667 | 429,184 |
| 20% | 20.0% | 287,111 | 286,720 |
| 10% | 10.1% | 143,556 | 144,341 |
| Active Idle | 0 | 0 | |
| Target Load | Actual Load | ssj_ops | |
|---|---|---|---|
| Target | Actual | ||
| Calibration 1 | 1,426,618 | ||
| Calibration 2 | 1,424,255 | ||
| Calibration 3 | 1,429,795 | ||
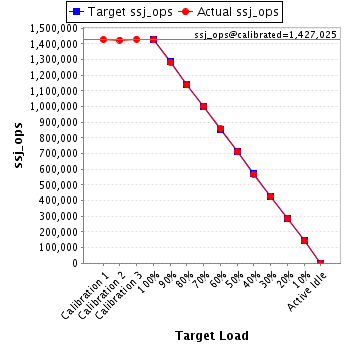
| ssj_ops@calibrated=1,427,025 | |||
| 100% | 99.8% | 1,427,025 | 1,424,627 |
| 90% | 90.0% | 1,284,322 | 1,283,897 |
| 80% | 79.8% | 1,141,620 | 1,139,323 |
| 70% | 70.0% | 998,917 | 999,292 |
| 60% | 60.1% | 856,215 | 857,677 |
| 50% | 49.9% | 713,512 | 711,757 |
| 40% | 39.9% | 570,810 | 569,301 |
| 30% | 30.0% | 428,107 | 428,522 |
| 20% | 20.1% | 285,405 | 286,212 |
| 10% | 10.0% | 142,702 | 142,290 |
| Active Idle | 0 | 0 | |
| Target Load | Actual Load | ssj_ops | |
|---|---|---|---|
| Target | Actual | ||
| Calibration 1 | 1,425,874 | ||
| Calibration 2 | 1,420,247 | ||
| Calibration 3 | 1,423,948 | ||
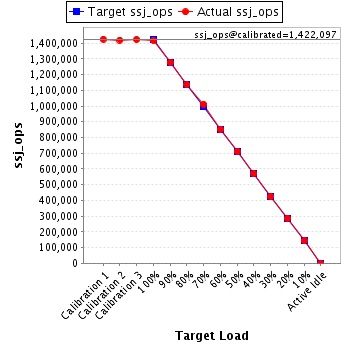
| ssj_ops@calibrated=1,422,097 | |||
| 100% | 99.7% | 1,422,097 | 1,418,283 |
| 90% | 89.8% | 1,279,887 | 1,277,413 |
| 80% | 80.0% | 1,137,678 | 1,137,609 |
| 70% | 71.2% | 995,468 | 1,012,328 |
| 60% | 60.0% | 853,258 | 853,919 |
| 50% | 50.1% | 711,049 | 712,685 |
| 40% | 40.1% | 568,839 | 570,135 |
| 30% | 29.9% | 426,629 | 424,707 |
| 20% | 20.1% | 284,419 | 285,670 |
| 10% | 10.1% | 142,210 | 143,071 |
| Active Idle | 0 | 0 | |