SPECpower_ssj2008
Host 'NODE06' Performance Report
Copyright © 2007-2018 Standard Performance Evaluation Corporation
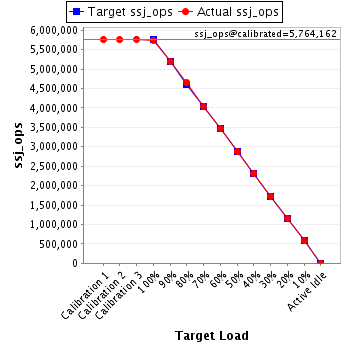
| Hewlett Packard Enterprise Synergy 480 Gen10 Compute Module | ssj_ops@100% = 5,744,838 ssj_ops@100% per JVM = 1,436,210 |
||||
| Test Sponsor: | Hewlett Packard Enterprise | SPEC License #: | 3 | Test Method: | Multi Node |
| Tested By: | Hewlett Packard Enterprise | Test Location: | Houston, TX, USA | Test Date: | Aug 24, 2018 |
| Hardware Availability: | Jun-2018 | Software Availability: | Mar-2018 | Publication: | Sep 12, 2018 |
| System Source: | Single Supplier | System Designation: | Server | Power Provisioning: | Line-powered |
| Target Load | Actual Load | ssj_ops | |
|---|---|---|---|
| Target | Actual | ||
| Calibration 1 | 5,761,450 | ||
| Calibration 2 | 5,758,038 | ||
| Calibration 3 | 5,770,286 | ||
| ssj_ops@calibrated=5,764,162 | |||
| 100% | 99.7% | 5,764,162 | 5,744,838 |
| 90% | 90.0% | 5,187,746 | 5,186,644 |
| 80% | 80.6% | 4,611,330 | 4,646,848 |
| 70% | 70.0% | 4,034,914 | 4,032,153 |
| 60% | 60.0% | 3,458,497 | 3,457,642 |
| 50% | 50.1% | 2,882,081 | 2,885,425 |
| 40% | 40.1% | 2,305,665 | 2,308,793 |
| 30% | 30.0% | 1,729,249 | 1,728,090 |
| 20% | 20.0% | 1,152,832 | 1,154,959 |
| 10% | 10.0% | 576,416 | 575,980 |
| Active Idle | 0 | 0 | |
| Set Identifier: | SUT |
| Set Description: | System Under Test |
| # of Identical Nodes: | 6 |
| Comment: | SUT |
| Hardware | |
|---|---|
| Hardware Vendor: | Hewlett Packard Enterprise |
| Model: | Synergy 480 Gen10 Compute Module |
| Form Factor: | Other |
| CPU Name: | Intel Xeon Platinum 8180 2.50GHz |
| CPU Characteristics: | 28-Core, 2.50 GHz, 38.5 MB L3 Cache |
| CPU Frequency (MHz): | 2500 |
| CPU(s) Enabled: | 56 cores, 2 chips, 28 cores/chip |
| Hardware Threads: | 112 (2 / core) |
| CPU(s) Orderable: | 1,2 chips |
| Primary Cache: | 32 KB I + 32 KB D on chip per core |
| Secondary Cache: | 1 MB I+D on chip per core |
| Tertiary Cache: | 39424 KB I+D on chip per chip |
| Other Cache: | None |
| Memory Amount (GB): | 192 |
| # and size of DIMM: | 12 x 16384 MB |
| Memory Details: | 12 x 16GB 2Rx8 PC4-2666-V ECC; slots 1, 3, 5, 8, 10 and 12 populated on each CPU socket |
| Power Supply Quantity and Rating (W): | None |
| Power Supply Details: | Shared |
| Disk Drive: | 1 x HPE Synergy 480 Gen10 M.2 FIO Adapter Board Kit (873165-B21); 1 x HPE 480GB SATA 6G Read Intensive M.2 2280 SSD (875498-B21) |
| Disk Controller: | 1 x HPE Smart Array S100i SR Gen10 |
| # and type of Network Interface Cards (NICs) Installed: | 1 x HPE Synergy 3820C 10/20Gb 2-port Converged Network Adapter (777430-B21) |
| NICs Enabled in Firmware / OS / Connected: | 2/1/1 |
| Network Speed (Mbit): | 10000 |
| Keyboard: | None |
| Mouse: | None |
| Monitor: | None |
| Optical Drives: | No |
| Other Hardware: | None |
| Software | |
|---|---|
| Power Management: | Enabled (see SUT Notes) |
| Operating System (OS): | Windows Server 2012 R2 Datacenter |
| OS Version: | 6.3 (Build 9600) |
| Filesystem: | NTFS |
| JVM Vendor: | Oracle Corporation |
| JVM Version: | Java HotSpot(TM) 64-Bit Server VM (build 24.80-b11, mixed mode), version 1.7.0_80 |
| JVM Command-line Options: | -server -Xmn19g -Xms21g -Xmx21g -XX:SurvivorRatio=1 -XX:TargetSurvivorRatio=99 -XX:ParallelGCThreads=28 -XX:AllocatePrefetchDistance=256 -XX:AllocatePrefetchLines=4 -XX:LoopUnrollLimit=45 -XX:InitialTenuringThreshold=12 -XX:MaxTenuringThreshold=15 -XX:InlineSmallCode=9000 -XX:MaxInlineSize=270 -XX:FreqInlineSize=6000 -XX:+UseLargePages -XX:+UseParallelOldGC -XX:+AggressiveOpts |
| JVM Affinity: | start /NODE [0,1,2,3] /AFFINITY [0xFFFFFFF] |
| JVM Instances: | 4 |
| JVM Initial Heap (MB): | 21000 |
| JVM Maximum Heap (MB): | 21000 |
| JVM Address Bits: | 64 |
| Boot Firmware Version: | I42 v1.32 (02/01/2018) |
| Management Firmware Version: | 1.15 Aug 17 2017 |
| Workload Version: | SSJ 1.2.10 |
| Director Location: | Controller |
| Other Software: | HPE Composer Version 3.10.07 (HPE OneView) with HPE Synergy Custom SPP Bundle 2017.10.20180323; Microsoft Windows KB4054519, KB4056898 |
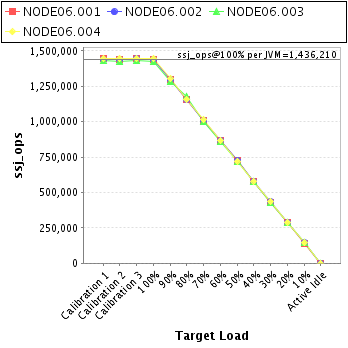
| JVM Instance | ssj_ops@100% |
|---|---|
| NODE06.001 | 1,438,214 |
| NODE06.002 | 1,438,435 |
| NODE06.003 | 1,423,789 |
| NODE06.004 | 1,444,400 |
| ssj_ops@100% | 5,744,838 |
| ssj_ops@100% per JVM | 1,436,210 |
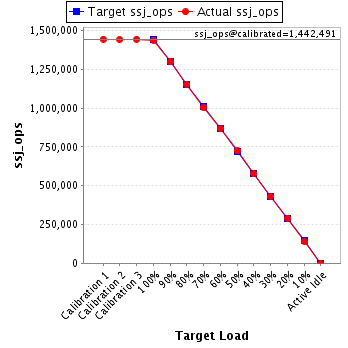
| Target Load | Actual Load | ssj_ops | |
|---|---|---|---|
| Target | Actual | ||
| Calibration 1 | 1,443,985 | ||
| Calibration 2 | 1,440,868 | ||
| Calibration 3 | 1,444,113 | ||
| ssj_ops@calibrated=1,442,491 | |||
| 100% | 99.7% | 1,442,491 | 1,438,214 |
| 90% | 89.9% | 1,298,241 | 1,297,161 |
| 80% | 80.0% | 1,153,992 | 1,153,852 |
| 70% | 69.7% | 1,009,743 | 1,005,743 |
| 60% | 60.0% | 865,494 | 866,038 |
| 50% | 50.2% | 721,245 | 723,515 |
| 40% | 39.9% | 576,996 | 575,837 |
| 30% | 29.9% | 432,747 | 431,933 |
| 20% | 20.1% | 288,498 | 290,325 |
| 10% | 9.9% | 144,249 | 142,998 |
| Active Idle | 0 | 0 | |
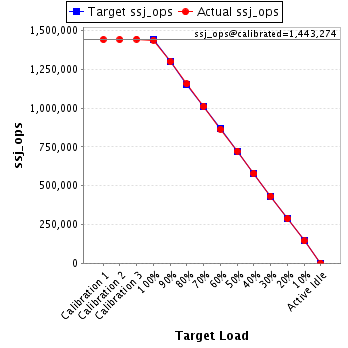
| Target Load | Actual Load | ssj_ops | |
|---|---|---|---|
| Target | Actual | ||
| Calibration 1 | 1,442,079 | ||
| Calibration 2 | 1,441,886 | ||
| Calibration 3 | 1,444,661 | ||
| ssj_ops@calibrated=1,443,274 | |||
| 100% | 99.7% | 1,443,274 | 1,438,435 |
| 90% | 90.1% | 1,298,946 | 1,300,277 |
| 80% | 80.1% | 1,154,619 | 1,156,178 |
| 70% | 70.1% | 1,010,292 | 1,011,945 |
| 60% | 59.9% | 865,964 | 864,610 |
| 50% | 50.1% | 721,637 | 722,969 |
| 40% | 40.0% | 577,309 | 577,508 |
| 30% | 30.0% | 432,982 | 433,396 |
| 20% | 19.9% | 288,655 | 287,185 |
| 10% | 10.0% | 144,327 | 144,222 |
| Active Idle | 0 | 0 | |
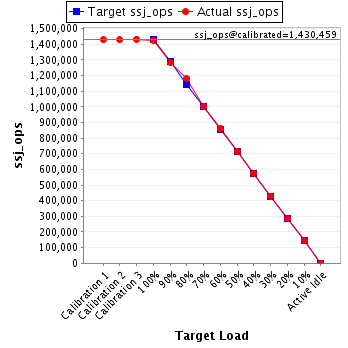
| Target Load | Actual Load | ssj_ops | |
|---|---|---|---|
| Target | Actual | ||
| Calibration 1 | 1,428,952 | ||
| Calibration 2 | 1,428,179 | ||
| Calibration 3 | 1,432,740 | ||
| ssj_ops@calibrated=1,430,459 | |||
| 100% | 99.5% | 1,430,459 | 1,423,789 |
| 90% | 89.9% | 1,287,413 | 1,286,353 |
| 80% | 82.4% | 1,144,367 | 1,179,354 |
| 70% | 70.0% | 1,001,321 | 1,001,161 |
| 60% | 60.1% | 858,275 | 859,098 |
| 50% | 50.2% | 715,230 | 717,614 |
| 40% | 40.2% | 572,184 | 574,536 |
| 30% | 29.9% | 429,138 | 427,672 |
| 20% | 20.0% | 286,092 | 286,324 |
| 10% | 10.1% | 143,046 | 143,889 |
| Active Idle | 0 | 0 | |
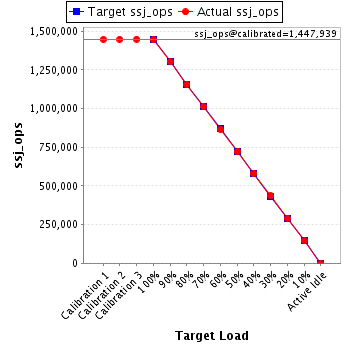
| Target Load | Actual Load | ssj_ops | |
|---|---|---|---|
| Target | Actual | ||
| Calibration 1 | 1,446,434 | ||
| Calibration 2 | 1,447,105 | ||
| Calibration 3 | 1,448,773 | ||
| ssj_ops@calibrated=1,447,939 | |||
| 100% | 99.8% | 1,447,939 | 1,444,400 |
| 90% | 90.0% | 1,303,145 | 1,302,853 |
| 80% | 79.9% | 1,158,351 | 1,157,464 |
| 70% | 70.0% | 1,013,557 | 1,013,303 |
| 60% | 59.9% | 868,763 | 867,897 |
| 50% | 49.8% | 723,969 | 721,327 |
| 40% | 40.1% | 579,176 | 580,913 |
| 30% | 30.0% | 434,382 | 435,090 |
| 20% | 20.1% | 289,588 | 291,125 |
| 10% | 10.0% | 144,794 | 144,870 |
| Active Idle | 0 | 0 | |