SPECpower_ssj2008
Host 'NODE02' Performance Report
Copyright © 2007-2018 Standard Performance Evaluation Corporation
| Hewlett Packard Enterprise Synergy 480 Gen10 Compute Module | ssj_ops@100% = 5,669,432 ssj_ops@100% per JVM = 1,417,358 |
||||
| Test Sponsor: | Hewlett Packard Enterprise | SPEC License #: | 3 | Test Method: | Multi Node |
| Tested By: | Hewlett Packard Enterprise | Test Location: | Houston, TX, USA | Test Date: | Aug 24, 2018 |
| Hardware Availability: | Jun-2018 | Software Availability: | Mar-2018 | Publication: | Sep 12, 2018 |
| System Source: | Single Supplier | System Designation: | Server | Power Provisioning: | Line-powered |
| Target Load | Actual Load | ssj_ops | |
|---|---|---|---|
| Target | Actual | ||
| Calibration 1 | 5,694,773 | ||
| Calibration 2 | 5,682,334 | ||
| Calibration 3 | 5,686,107 | ||
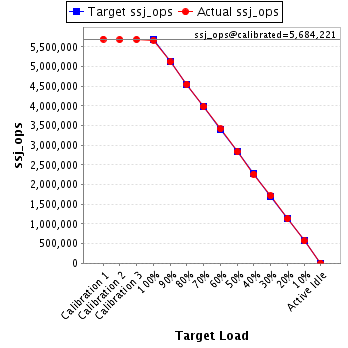
| ssj_ops@calibrated=5,684,221 | |||
| 100% | 99.7% | 5,684,221 | 5,669,432 |
| 90% | 90.0% | 5,115,799 | 5,116,728 |
| 80% | 80.0% | 4,547,377 | 4,546,937 |
| 70% | 70.1% | 3,978,954 | 3,984,686 |
| 60% | 60.0% | 3,410,532 | 3,411,998 |
| 50% | 49.9% | 2,842,110 | 2,835,074 |
| 40% | 39.9% | 2,273,688 | 2,266,360 |
| 30% | 30.1% | 1,705,266 | 1,709,403 |
| 20% | 19.9% | 1,136,844 | 1,132,556 |
| 10% | 10.0% | 568,422 | 569,045 |
| Active Idle | 0 | 0 | |
| Set Identifier: | SUT |
| Set Description: | System Under Test |
| # of Identical Nodes: | 6 |
| Comment: | SUT |
| Hardware | |
|---|---|
| Hardware Vendor: | Hewlett Packard Enterprise |
| Model: | Synergy 480 Gen10 Compute Module |
| Form Factor: | Other |
| CPU Name: | Intel Xeon Platinum 8180 2.50GHz |
| CPU Characteristics: | 28-Core, 2.50 GHz, 38.5 MB L3 Cache |
| CPU Frequency (MHz): | 2500 |
| CPU(s) Enabled: | 56 cores, 2 chips, 28 cores/chip |
| Hardware Threads: | 112 (2 / core) |
| CPU(s) Orderable: | 1,2 chips |
| Primary Cache: | 32 KB I + 32 KB D on chip per core |
| Secondary Cache: | 1 MB I+D on chip per core |
| Tertiary Cache: | 39424 KB I+D on chip per chip |
| Other Cache: | None |
| Memory Amount (GB): | 192 |
| # and size of DIMM: | 12 x 16384 MB |
| Memory Details: | 12 x 16GB 2Rx8 PC4-2666-V ECC; slots 1, 3, 5, 8, 10 and 12 populated on each CPU socket |
| Power Supply Quantity and Rating (W): | None |
| Power Supply Details: | Shared |
| Disk Drive: | 1 x HPE Synergy 480 Gen10 M.2 FIO Adapter Board Kit (873165-B21); 1 x HPE 480GB SATA 6G Read Intensive M.2 2280 SSD (875498-B21) |
| Disk Controller: | 1 x HPE Smart Array S100i SR Gen10 |
| # and type of Network Interface Cards (NICs) Installed: | 1 x HPE Synergy 3820C 10/20Gb 2-port Converged Network Adapter (777430-B21) |
| NICs Enabled in Firmware / OS / Connected: | 2/1/1 |
| Network Speed (Mbit): | 10000 |
| Keyboard: | None |
| Mouse: | None |
| Monitor: | None |
| Optical Drives: | No |
| Other Hardware: | None |
| Software | |
|---|---|
| Power Management: | Enabled (see SUT Notes) |
| Operating System (OS): | Windows Server 2012 R2 Datacenter |
| OS Version: | 6.3 (Build 9600) |
| Filesystem: | NTFS |
| JVM Vendor: | Oracle Corporation |
| JVM Version: | Java HotSpot(TM) 64-Bit Server VM (build 24.80-b11, mixed mode), version 1.7.0_80 |
| JVM Command-line Options: | -server -Xmn19g -Xms21g -Xmx21g -XX:SurvivorRatio=1 -XX:TargetSurvivorRatio=99 -XX:ParallelGCThreads=28 -XX:AllocatePrefetchDistance=256 -XX:AllocatePrefetchLines=4 -XX:LoopUnrollLimit=45 -XX:InitialTenuringThreshold=12 -XX:MaxTenuringThreshold=15 -XX:InlineSmallCode=9000 -XX:MaxInlineSize=270 -XX:FreqInlineSize=6000 -XX:+UseLargePages -XX:+UseParallelOldGC -XX:+AggressiveOpts |
| JVM Affinity: | start /NODE [0,1,2,3] /AFFINITY [0xFFFFFFF] |
| JVM Instances: | 4 |
| JVM Initial Heap (MB): | 21000 |
| JVM Maximum Heap (MB): | 21000 |
| JVM Address Bits: | 64 |
| Boot Firmware Version: | I42 v1.32 (02/01/2018) |
| Management Firmware Version: | 1.15 Aug 17 2017 |
| Workload Version: | SSJ 1.2.10 |
| Director Location: | Controller |
| Other Software: | HPE Composer Version 3.10.07 (HPE OneView) with HPE Synergy Custom SPP Bundle 2017.10.20180323; Microsoft Windows KB4054519, KB4056898 |
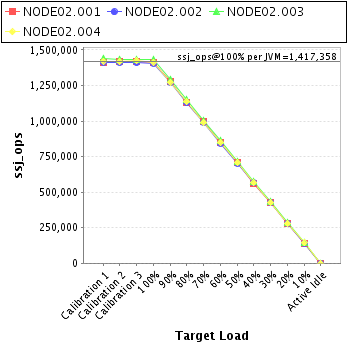
| JVM Instance | ssj_ops@100% |
|---|---|
| NODE02.001 | 1,413,632 |
| NODE02.002 | 1,408,338 |
| NODE02.003 | 1,432,412 |
| NODE02.004 | 1,415,050 |
| ssj_ops@100% | 5,669,432 |
| ssj_ops@100% per JVM | 1,417,358 |
| Target Load | Actual Load | ssj_ops | |
|---|---|---|---|
| Target | Actual | ||
| Calibration 1 | 1,415,358 | ||
| Calibration 2 | 1,416,750 | ||
| Calibration 3 | 1,416,927 | ||
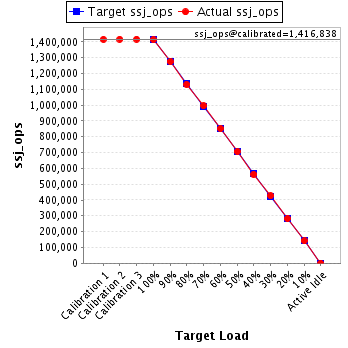
| ssj_ops@calibrated=1,416,838 | |||
| 100% | 99.8% | 1,416,838 | 1,413,632 |
| 90% | 90.0% | 1,275,154 | 1,274,971 |
| 80% | 79.8% | 1,133,471 | 1,130,534 |
| 70% | 70.2% | 991,787 | 995,264 |
| 60% | 60.1% | 850,103 | 851,341 |
| 50% | 49.8% | 708,419 | 706,142 |
| 40% | 39.7% | 566,735 | 562,249 |
| 30% | 30.1% | 425,051 | 426,381 |
| 20% | 19.9% | 283,368 | 281,674 |
| 10% | 10.0% | 141,684 | 141,743 |
| Active Idle | 0 | 0 | |
| Target Load | Actual Load | ssj_ops | |
|---|---|---|---|
| Target | Actual | ||
| Calibration 1 | 1,414,763 | ||
| Calibration 2 | 1,411,674 | ||
| Calibration 3 | 1,411,176 | ||
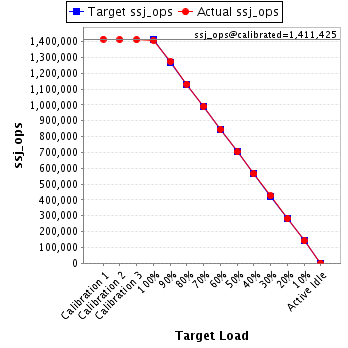
| ssj_ops@calibrated=1,411,425 | |||
| 100% | 99.8% | 1,411,425 | 1,408,338 |
| 90% | 90.2% | 1,270,283 | 1,272,881 |
| 80% | 80.0% | 1,129,140 | 1,129,810 |
| 70% | 70.2% | 987,998 | 991,423 |
| 60% | 59.9% | 846,855 | 845,358 |
| 50% | 49.8% | 705,713 | 703,260 |
| 40% | 40.0% | 564,570 | 564,572 |
| 30% | 30.1% | 423,428 | 424,852 |
| 20% | 19.9% | 282,285 | 281,467 |
| 10% | 10.1% | 141,143 | 141,899 |
| Active Idle | 0 | 0 | |
| Target Load | Actual Load | ssj_ops | |
|---|---|---|---|
| Target | Actual | ||
| Calibration 1 | 1,442,280 | ||
| Calibration 2 | 1,435,345 | ||
| Calibration 3 | 1,435,442 | ||
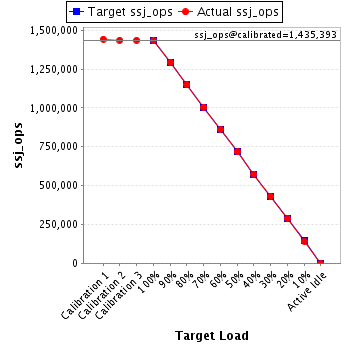
| ssj_ops@calibrated=1,435,393 | |||
| 100% | 99.8% | 1,435,393 | 1,432,412 |
| 90% | 90.2% | 1,291,854 | 1,294,604 |
| 80% | 80.1% | 1,148,315 | 1,149,586 |
| 70% | 70.1% | 1,004,775 | 1,005,518 |
| 60% | 60.1% | 861,236 | 862,895 |
| 50% | 49.9% | 717,697 | 716,962 |
| 40% | 40.0% | 574,157 | 573,778 |
| 30% | 30.1% | 430,618 | 431,428 |
| 20% | 20.0% | 287,079 | 287,735 |
| 10% | 9.9% | 143,539 | 142,746 |
| Active Idle | 0 | 0 | |
| Target Load | Actual Load | ssj_ops | |
|---|---|---|---|
| Target | Actual | ||
| Calibration 1 | 1,422,372 | ||
| Calibration 2 | 1,418,566 | ||
| Calibration 3 | 1,422,562 | ||
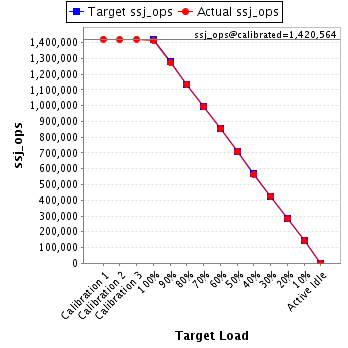
| ssj_ops@calibrated=1,420,564 | |||
| 100% | 99.6% | 1,420,564 | 1,415,050 |
| 90% | 89.7% | 1,278,508 | 1,274,272 |
| 80% | 80.0% | 1,136,451 | 1,137,007 |
| 70% | 69.9% | 994,395 | 992,480 |
| 60% | 60.0% | 852,338 | 852,404 |
| 50% | 49.9% | 710,282 | 708,709 |
| 40% | 39.8% | 568,226 | 565,760 |
| 30% | 30.0% | 426,169 | 426,742 |
| 20% | 19.8% | 284,113 | 281,680 |
| 10% | 10.0% | 142,056 | 142,657 |
| Active Idle | 0 | 0 | |