SPECpower_ssj2008
Host 'NODE05' Performance Report
Copyright © 2007-2018 Standard Performance Evaluation Corporation
| Hewlett Packard Enterprise Synergy 480 Gen10 Compute Module | ssj_ops@100% = 5,731,599 ssj_ops@100% per JVM = 1,432,900 |
||||
| Test Sponsor: | Hewlett Packard Enterprise | SPEC License #: | 3 | Test Method: | Multi Node |
| Tested By: | Hewlett Packard Enterprise | Test Location: | Houston, TX, USA | Test Date: | Aug 24, 2018 |
| Hardware Availability: | Jun-2018 | Software Availability: | Mar-2018 | Publication: | Sep 12, 2018 |
| System Source: | Single Supplier | System Designation: | Server | Power Provisioning: | Line-powered |
| Target Load | Actual Load | ssj_ops | |
|---|---|---|---|
| Target | Actual | ||
| Calibration 1 | 5,753,216 | ||
| Calibration 2 | 5,743,809 | ||
| Calibration 3 | 5,755,431 | ||
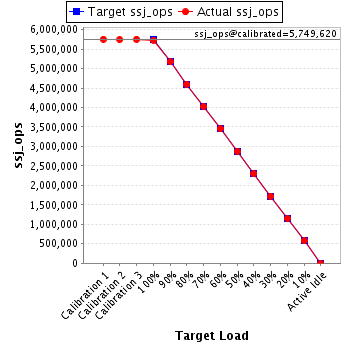
| ssj_ops@calibrated=5,749,620 | |||
| 100% | 99.7% | 5,749,620 | 5,731,599 |
| 90% | 90.0% | 5,174,658 | 5,172,363 |
| 80% | 80.0% | 4,599,696 | 4,599,736 |
| 70% | 70.0% | 4,024,734 | 4,022,979 |
| 60% | 60.0% | 3,449,772 | 3,451,258 |
| 50% | 50.0% | 2,874,810 | 2,874,815 |
| 40% | 39.9% | 2,299,848 | 2,294,940 |
| 30% | 30.0% | 1,724,886 | 1,726,902 |
| 20% | 20.0% | 1,149,924 | 1,150,083 |
| 10% | 10.0% | 574,962 | 576,037 |
| Active Idle | 0 | 0 | |
| Set Identifier: | SUT |
| Set Description: | System Under Test |
| # of Identical Nodes: | 6 |
| Comment: | SUT |
| Hardware | |
|---|---|
| Hardware Vendor: | Hewlett Packard Enterprise |
| Model: | Synergy 480 Gen10 Compute Module |
| Form Factor: | Other |
| CPU Name: | Intel Xeon Platinum 8180 2.50GHz |
| CPU Characteristics: | 28-Core, 2.50 GHz, 38.5 MB L3 Cache |
| CPU Frequency (MHz): | 2500 |
| CPU(s) Enabled: | 56 cores, 2 chips, 28 cores/chip |
| Hardware Threads: | 112 (2 / core) |
| CPU(s) Orderable: | 1,2 chips |
| Primary Cache: | 32 KB I + 32 KB D on chip per core |
| Secondary Cache: | 1 MB I+D on chip per core |
| Tertiary Cache: | 39424 KB I+D on chip per chip |
| Other Cache: | None |
| Memory Amount (GB): | 192 |
| # and size of DIMM: | 12 x 16384 MB |
| Memory Details: | 12 x 16GB 2Rx8 PC4-2666-V ECC; slots 1, 3, 5, 8, 10 and 12 populated on each CPU socket |
| Power Supply Quantity and Rating (W): | None |
| Power Supply Details: | Shared |
| Disk Drive: | 1 x HPE Synergy 480 Gen10 M.2 FIO Adapter Board Kit (873165-B21); 1 x HPE 480GB SATA 6G Read Intensive M.2 2280 SSD (875498-B21) |
| Disk Controller: | 1 x HPE Smart Array S100i SR Gen10 |
| # and type of Network Interface Cards (NICs) Installed: | 1 x HPE Synergy 3820C 10/20Gb 2-port Converged Network Adapter (777430-B21) |
| NICs Enabled in Firmware / OS / Connected: | 2/1/1 |
| Network Speed (Mbit): | 10000 |
| Keyboard: | None |
| Mouse: | None |
| Monitor: | None |
| Optical Drives: | No |
| Other Hardware: | None |
| Software | |
|---|---|
| Power Management: | Enabled (see SUT Notes) |
| Operating System (OS): | Windows Server 2012 R2 Datacenter |
| OS Version: | 6.3 (Build 9600) |
| Filesystem: | NTFS |
| JVM Vendor: | Oracle Corporation |
| JVM Version: | Java HotSpot(TM) 64-Bit Server VM (build 24.80-b11, mixed mode), version 1.7.0_80 |
| JVM Command-line Options: | -server -Xmn19g -Xms21g -Xmx21g -XX:SurvivorRatio=1 -XX:TargetSurvivorRatio=99 -XX:ParallelGCThreads=28 -XX:AllocatePrefetchDistance=256 -XX:AllocatePrefetchLines=4 -XX:LoopUnrollLimit=45 -XX:InitialTenuringThreshold=12 -XX:MaxTenuringThreshold=15 -XX:InlineSmallCode=9000 -XX:MaxInlineSize=270 -XX:FreqInlineSize=6000 -XX:+UseLargePages -XX:+UseParallelOldGC -XX:+AggressiveOpts |
| JVM Affinity: | start /NODE [0,1,2,3] /AFFINITY [0xFFFFFFF] |
| JVM Instances: | 4 |
| JVM Initial Heap (MB): | 21000 |
| JVM Maximum Heap (MB): | 21000 |
| JVM Address Bits: | 64 |
| Boot Firmware Version: | I42 v1.32 (02/01/2018) |
| Management Firmware Version: | 1.15 Aug 17 2017 |
| Workload Version: | SSJ 1.2.10 |
| Director Location: | Controller |
| Other Software: | HPE Composer Version 3.10.07 (HPE OneView) with HPE Synergy Custom SPP Bundle 2017.10.20180323; Microsoft Windows KB4054519, KB4056898 |
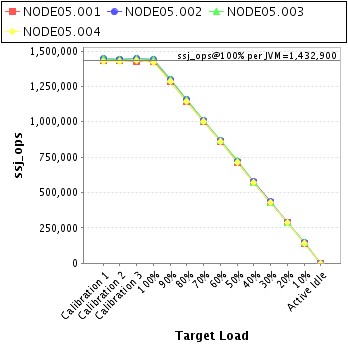
| JVM Instance | ssj_ops@100% |
|---|---|
| NODE05.001 | 1,427,521 |
| NODE05.002 | 1,441,919 |
| NODE05.003 | 1,441,014 |
| NODE05.004 | 1,421,146 |
| ssj_ops@100% | 5,731,599 |
| ssj_ops@100% per JVM | 1,432,900 |
| Target Load | Actual Load | ssj_ops | |
|---|---|---|---|
| Target | Actual | ||
| Calibration 1 | 1,435,263 | ||
| Calibration 2 | 1,432,308 | ||
| Calibration 3 | 1,429,562 | ||
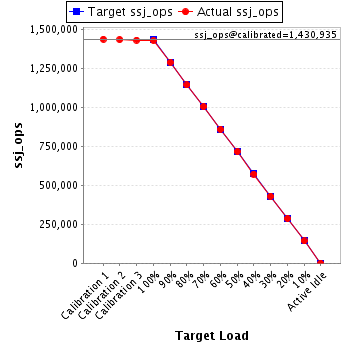
| ssj_ops@calibrated=1,430,935 | |||
| 100% | 99.8% | 1,430,935 | 1,427,521 |
| 90% | 90.0% | 1,287,842 | 1,287,499 |
| 80% | 79.8% | 1,144,748 | 1,141,863 |
| 70% | 70.1% | 1,001,655 | 1,003,588 |
| 60% | 60.0% | 858,561 | 858,173 |
| 50% | 50.0% | 715,468 | 714,875 |
| 40% | 40.0% | 572,374 | 571,692 |
| 30% | 30.1% | 429,281 | 430,087 |
| 20% | 20.0% | 286,187 | 285,604 |
| 10% | 10.0% | 143,094 | 142,702 |
| Active Idle | 0 | 0 | |
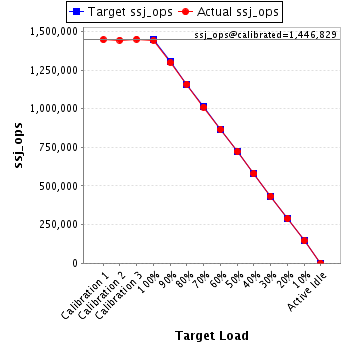
| Target Load | Actual Load | ssj_ops | |
|---|---|---|---|
| Target | Actual | ||
| Calibration 1 | 1,446,260 | ||
| Calibration 2 | 1,443,895 | ||
| Calibration 3 | 1,449,764 | ||
| ssj_ops@calibrated=1,446,829 | |||
| 100% | 99.7% | 1,446,829 | 1,441,919 |
| 90% | 89.7% | 1,302,146 | 1,298,399 |
| 80% | 80.1% | 1,157,463 | 1,158,426 |
| 70% | 69.9% | 1,012,781 | 1,010,866 |
| 60% | 59.8% | 868,098 | 865,805 |
| 50% | 49.9% | 723,415 | 722,556 |
| 40% | 40.0% | 578,732 | 579,131 |
| 30% | 30.1% | 434,049 | 435,054 |
| 20% | 20.0% | 289,366 | 288,650 |
| 10% | 10.1% | 144,683 | 145,932 |
| Active Idle | 0 | 0 | |
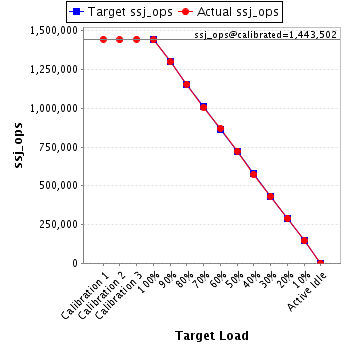
| Target Load | Actual Load | ssj_ops | |
|---|---|---|---|
| Target | Actual | ||
| Calibration 1 | 1,445,419 | ||
| Calibration 2 | 1,441,064 | ||
| Calibration 3 | 1,445,940 | ||
| ssj_ops@calibrated=1,443,502 | |||
| 100% | 99.8% | 1,443,502 | 1,441,014 |
| 90% | 90.0% | 1,299,152 | 1,299,033 |
| 80% | 80.0% | 1,154,802 | 1,155,253 |
| 70% | 69.8% | 1,010,452 | 1,007,825 |
| 60% | 60.2% | 866,101 | 869,680 |
| 50% | 50.1% | 721,751 | 723,784 |
| 40% | 39.7% | 577,401 | 573,643 |
| 30% | 29.9% | 433,051 | 432,262 |
| 20% | 20.1% | 288,700 | 289,471 |
| 10% | 10.0% | 144,350 | 144,901 |
| Active Idle | 0 | 0 | |
| Target Load | Actual Load | ssj_ops | |
|---|---|---|---|
| Target | Actual | ||
| Calibration 1 | 1,426,275 | ||
| Calibration 2 | 1,426,541 | ||
| Calibration 3 | 1,430,164 | ||
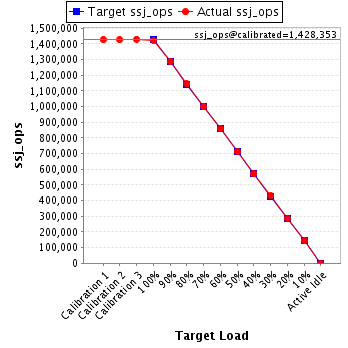
| ssj_ops@calibrated=1,428,353 | |||
| 100% | 99.5% | 1,428,353 | 1,421,146 |
| 90% | 90.1% | 1,285,517 | 1,287,432 |
| 80% | 80.1% | 1,142,682 | 1,144,195 |
| 70% | 70.1% | 999,847 | 1,000,700 |
| 60% | 60.0% | 857,012 | 857,600 |
| 50% | 50.0% | 714,176 | 713,600 |
| 40% | 39.9% | 571,341 | 570,474 |
| 30% | 30.1% | 428,506 | 429,499 |
| 20% | 20.0% | 285,671 | 286,359 |
| 10% | 10.0% | 142,835 | 142,502 |
| Active Idle | 0 | 0 | |