SPECpower_ssj2008
Host 'NODE01' Performance Report
Copyright © 2007-2018 Standard Performance Evaluation Corporation
| Hewlett Packard Enterprise Synergy 480 Gen10 Compute Module | ssj_ops@100% = 5,716,260 ssj_ops@100% per JVM = 1,429,065 |
||||
| Test Sponsor: | Hewlett Packard Enterprise | SPEC License #: | 3 | Test Method: | Multi Node |
| Tested By: | Hewlett Packard Enterprise | Test Location: | Houston, TX, USA | Test Date: | Aug 24, 2018 |
| Hardware Availability: | Jun-2018 | Software Availability: | Mar-2018 | Publication: | Sep 12, 2018 |
| System Source: | Single Supplier | System Designation: | Server | Power Provisioning: | Line-powered |
| Target Load | Actual Load | ssj_ops | |
|---|---|---|---|
| Target | Actual | ||
| Calibration 1 | 5,723,279 | ||
| Calibration 2 | 5,724,033 | ||
| Calibration 3 | 5,738,205 | ||
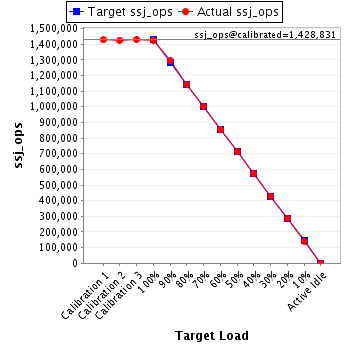
| ssj_ops@calibrated=5,731,119 | |||
| 100% | 99.7% | 5,731,119 | 5,716,260 |
| 90% | 90.2% | 5,158,007 | 5,167,950 |
| 80% | 80.0% | 4,584,895 | 4,586,668 |
| 70% | 70.1% | 4,011,783 | 4,019,028 |
| 60% | 60.0% | 3,438,671 | 3,436,834 |
| 50% | 49.9% | 2,865,559 | 2,860,132 |
| 40% | 40.0% | 2,292,447 | 2,293,509 |
| 30% | 30.0% | 1,719,336 | 1,721,712 |
| 20% | 20.0% | 1,146,224 | 1,146,294 |
| 10% | 10.0% | 573,112 | 573,876 |
| Active Idle | 0 | 0 | |
| Set Identifier: | SUT |
| Set Description: | System Under Test |
| # of Identical Nodes: | 6 |
| Comment: | SUT |
| Hardware | |
|---|---|
| Hardware Vendor: | Hewlett Packard Enterprise |
| Model: | Synergy 480 Gen10 Compute Module |
| Form Factor: | Other |
| CPU Name: | Intel Xeon Platinum 8180 2.50GHz |
| CPU Characteristics: | 28-Core, 2.50 GHz, 38.5 MB L3 Cache |
| CPU Frequency (MHz): | 2500 |
| CPU(s) Enabled: | 56 cores, 2 chips, 28 cores/chip |
| Hardware Threads: | 112 (2 / core) |
| CPU(s) Orderable: | 1,2 chips |
| Primary Cache: | 32 KB I + 32 KB D on chip per core |
| Secondary Cache: | 1 MB I+D on chip per core |
| Tertiary Cache: | 39424 KB I+D on chip per chip |
| Other Cache: | None |
| Memory Amount (GB): | 192 |
| # and size of DIMM: | 12 x 16384 MB |
| Memory Details: | 12 x 16GB 2Rx8 PC4-2666-V ECC; slots 1, 3, 5, 8, 10 and 12 populated on each CPU socket |
| Power Supply Quantity and Rating (W): | None |
| Power Supply Details: | Shared |
| Disk Drive: | 1 x HPE Synergy 480 Gen10 M.2 FIO Adapter Board Kit (873165-B21); 1 x HPE 480GB SATA 6G Read Intensive M.2 2280 SSD (875498-B21) |
| Disk Controller: | 1 x HPE Smart Array S100i SR Gen10 |
| # and type of Network Interface Cards (NICs) Installed: | 1 x HPE Synergy 3820C 10/20Gb 2-port Converged Network Adapter (777430-B21) |
| NICs Enabled in Firmware / OS / Connected: | 2/1/1 |
| Network Speed (Mbit): | 10000 |
| Keyboard: | None |
| Mouse: | None |
| Monitor: | None |
| Optical Drives: | No |
| Other Hardware: | None |
| Software | |
|---|---|
| Power Management: | Enabled (see SUT Notes) |
| Operating System (OS): | Windows Server 2012 R2 Datacenter |
| OS Version: | 6.3 (Build 9600) |
| Filesystem: | NTFS |
| JVM Vendor: | Oracle Corporation |
| JVM Version: | Java HotSpot(TM) 64-Bit Server VM (build 24.80-b11, mixed mode), version 1.7.0_80 |
| JVM Command-line Options: | -server -Xmn19g -Xms21g -Xmx21g -XX:SurvivorRatio=1 -XX:TargetSurvivorRatio=99 -XX:ParallelGCThreads=28 -XX:AllocatePrefetchDistance=256 -XX:AllocatePrefetchLines=4 -XX:LoopUnrollLimit=45 -XX:InitialTenuringThreshold=12 -XX:MaxTenuringThreshold=15 -XX:InlineSmallCode=9000 -XX:MaxInlineSize=270 -XX:FreqInlineSize=6000 -XX:+UseLargePages -XX:+UseParallelOldGC -XX:+AggressiveOpts |
| JVM Affinity: | start /NODE [0,1,2,3] /AFFINITY [0xFFFFFFF] |
| JVM Instances: | 4 |
| JVM Initial Heap (MB): | 21000 |
| JVM Maximum Heap (MB): | 21000 |
| JVM Address Bits: | 64 |
| Boot Firmware Version: | I42 v1.32 (02/01/2018) |
| Management Firmware Version: | 1.15 Aug 17 2017 |
| Workload Version: | SSJ 1.2.10 |
| Director Location: | Controller |
| Other Software: | HPE Composer Version 3.10.07 (HPE OneView) with HPE Synergy Custom SPP Bundle 2017.10.20180323; Microsoft Windows KB4054519, KB4056898 |
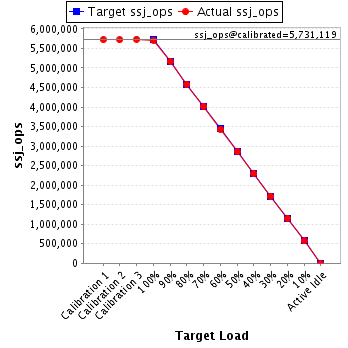
| JVM Instance | ssj_ops@100% |
|---|---|
| NODE01.001 | 1,445,198 |
| NODE01.002 | 1,417,410 |
| NODE01.003 | 1,427,287 |
| NODE01.004 | 1,426,365 |
| ssj_ops@100% | 5,716,260 |
| ssj_ops@100% per JVM | 1,429,065 |
| Target Load | Actual Load | ssj_ops | |
|---|---|---|---|
| Target | Actual | ||
| Calibration 1 | 1,443,866 | ||
| Calibration 2 | 1,448,010 | ||
| Calibration 3 | 1,452,116 | ||
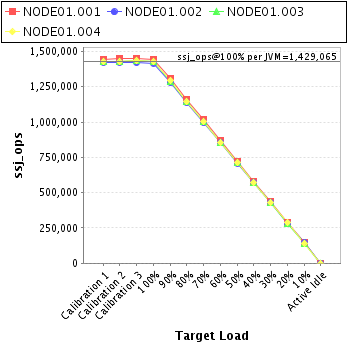
| ssj_ops@calibrated=1,450,063 | |||
| 100% | 99.7% | 1,450,063 | 1,445,198 |
| 90% | 90.2% | 1,305,057 | 1,308,073 |
| 80% | 79.9% | 1,160,051 | 1,158,536 |
| 70% | 70.3% | 1,015,044 | 1,018,793 |
| 60% | 60.0% | 870,038 | 870,449 |
| 50% | 49.8% | 725,032 | 721,982 |
| 40% | 40.0% | 580,025 | 580,483 |
| 30% | 30.0% | 435,019 | 434,455 |
| 20% | 19.9% | 290,013 | 288,406 |
| 10% | 10.0% | 145,006 | 145,187 |
| Active Idle | 0 | 0 | |
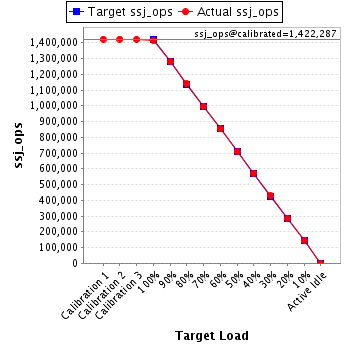
| Target Load | Actual Load | ssj_ops | |
|---|---|---|---|
| Target | Actual | ||
| Calibration 1 | 1,422,972 | ||
| Calibration 2 | 1,422,946 | ||
| Calibration 3 | 1,421,628 | ||
| ssj_ops@calibrated=1,422,287 | |||
| 100% | 99.7% | 1,422,287 | 1,417,410 |
| 90% | 90.0% | 1,280,058 | 1,279,915 |
| 80% | 80.1% | 1,137,830 | 1,138,700 |
| 70% | 70.0% | 995,601 | 995,560 |
| 60% | 60.0% | 853,372 | 852,807 |
| 50% | 49.8% | 711,144 | 708,981 |
| 40% | 40.2% | 568,915 | 571,746 |
| 30% | 30.1% | 426,686 | 427,498 |
| 20% | 20.0% | 284,457 | 284,658 |
| 10% | 10.1% | 142,229 | 144,356 |
| Active Idle | 0 | 0 | |
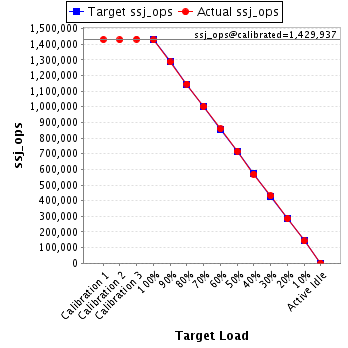
| Target Load | Actual Load | ssj_ops | |
|---|---|---|---|
| Target | Actual | ||
| Calibration 1 | 1,429,085 | ||
| Calibration 2 | 1,427,656 | ||
| Calibration 3 | 1,432,218 | ||
| ssj_ops@calibrated=1,429,937 | |||
| 100% | 99.8% | 1,429,937 | 1,427,287 |
| 90% | 90.0% | 1,286,943 | 1,286,295 |
| 80% | 80.1% | 1,143,950 | 1,145,590 |
| 70% | 70.1% | 1,000,956 | 1,002,417 |
| 60% | 60.0% | 857,962 | 858,258 |
| 50% | 50.1% | 714,968 | 715,867 |
| 40% | 39.8% | 571,975 | 569,436 |
| 30% | 30.1% | 428,981 | 430,270 |
| 20% | 19.9% | 285,987 | 284,885 |
| 10% | 10.0% | 142,994 | 142,396 |
| Active Idle | 0 | 0 | |
| Target Load | Actual Load | ssj_ops | |
|---|---|---|---|
| Target | Actual | ||
| Calibration 1 | 1,427,356 | ||
| Calibration 2 | 1,425,421 | ||
| Calibration 3 | 1,432,242 | ||
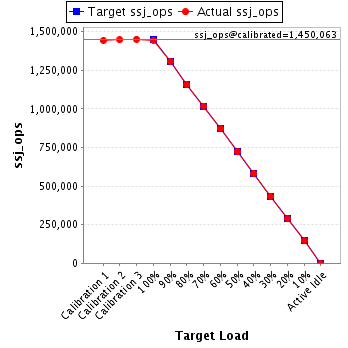
| ssj_ops@calibrated=1,428,831 | |||
| 100% | 99.8% | 1,428,831 | 1,426,365 |
| 90% | 90.5% | 1,285,948 | 1,293,667 |
| 80% | 80.1% | 1,143,065 | 1,143,842 |
| 70% | 70.1% | 1,000,182 | 1,002,257 |
| 60% | 59.9% | 857,299 | 855,320 |
| 50% | 49.9% | 714,416 | 713,303 |
| 40% | 40.0% | 571,533 | 571,844 |
| 30% | 30.1% | 428,649 | 429,488 |
| 20% | 20.2% | 285,766 | 288,344 |
| 10% | 9.9% | 142,883 | 141,938 |
| Active Idle | 0 | 0 | |