SPECpower_ssj2008
Host 'test4' Performance Report
Copyright © 2007-2015 Standard Performance Evaluation Corporation
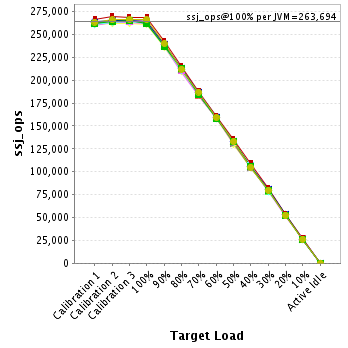
| Supermicro Inc. SYS-6038R-TXR | ssj_ops@100% = 3,164,328 ssj_ops@100% per JVM = 263,694 |
||||
| Test Sponsor: | Supermicro Inc | SPEC License #: | 1176 | Test Method: | Single Node |
| Tested By: | Supermicro Inc. | Test Location: | Chung-Ho Dist,TW, R.O.C | Test Date: | Apr 14, 2015 |
| Hardware Availability: | Jan-2015 | Software Availability: | Jun-2013 | Publication: | Jun 2, 2015 |
| System Source: | Single Supplier | System Designation: | Server | Power Provisioning: | Line-powered |
| Target Load | Actual Load | ssj_ops | |
|---|---|---|---|
| Target | Actual | ||
| Calibration 1 | 3,148,592 | ||
| Calibration 2 | 3,177,619 | ||
| Calibration 3 | 3,178,936 | ||
| ssj_ops@calibrated=3,178,277 | |||
| 100% | 99.6% | 3,178,277 | 3,164,328 |
| 90% | 90.0% | 2,860,450 | 2,858,968 |
| 80% | 79.9% | 2,542,622 | 2,538,260 |
| 70% | 70.0% | 2,224,794 | 2,224,652 |
| 60% | 60.0% | 1,906,966 | 1,905,961 |
| 50% | 50.0% | 1,589,139 | 1,589,054 |
| 40% | 40.0% | 1,271,311 | 1,270,247 |
| 30% | 30.1% | 953,483 | 956,240 |
| 20% | 20.0% | 635,655 | 636,825 |
| 10% | 10.0% | 317,828 | 317,613 |
| Active Idle | 0 | 0 | |

| Set Identifier: | sut |
| Set Description: | System Under Test |
| # of Identical Nodes: | 1 |
| Comment: | None |
| Hardware | |
|---|---|
| Hardware Vendor: | Supermicro Inc. |
| Model: | SYS-6038R-TXR |
| Form Factor: | 3U |
| CPU Name: | Intel Xeon E5-2699 V3 |
| CPU Characteristics: | 18 Core, 2.3GHz, 45MB L3 cache |
| CPU Frequency (MHz): | 2300 |
| CPU(s) Enabled: | 36 cores, 2 chips, 18 cores/chip |
| Hardware Threads: | 72 (2 / core) |
| CPU(s) Orderable: | 1,2 chipS |
| Primary Cache: | 32 KB I + 32 KB D on chip per core |
| Secondary Cache: | 256 KB I+D on chip per core |
| Tertiary Cache: | 45 MB I+D on chip per chip |
| Other Cache: | None |
| Memory Amount (GB): | 64 |
| # and size of DIMM: | 16 x 4096 MB |
| Memory Details: | 4GB 1Rx8 PC4-2133P; A1,A2,B1,B2,C1,C2,D1,D2,E1,E2,F1,F2,G1,G2,H1,H2 populated. |
| Power Supply Quantity and Rating (W): | 1 x 980 |
| Power Supply Details: | PWS-982-1R |
| Disk Drive: | 1 x Seagate SATA III 100 GB SSD 9XW152-003 |
| Disk Controller: | onboard SCU controller |
| # and type of Network Interface Cards (NICs) Installed: | 1 x Dual-port Onboard Intel I350 Gigabit Ethernet controller |
| NICs Enabled in Firmware / OS / Connected: | 2/1/1 |
| Network Speed (Mbit): | 1000 |
| Keyboard: | None |
| Mouse: | None |
| Monitor: | None |
| Optical Drives: | No |
| Other Hardware: | None |
| Software | |
|---|---|
| Power Management: | Power Saver |
| Operating System (OS): | Microsoft Windows Server Enterprise 2008 R2 SP1 |
| OS Version: | 6.1.7601 Build 7601 (64-bit) |
| Filesystem: | NTFS |
| JVM Vendor: | IBM Corporation |
| JVM Version: | IBM J9 VM (build 2.6, JRE 1.7.0 Windows Server 2008 R2 amd64-64 20120322_106209 (JIT enabled, AOT enabled)) |
| JVM Command-line Options: | -Xmn1690m -Xms2048m -Xmx2048m-Xaggressive -Xcompressedrefs -Xgcpolicy:gencon -XlockReservation -Xnoloa -XtlhPrefetch -Xlp -Xconcurrentlevel0 -Xthr:minimizeusercpu -Xgcthreads6 |
| JVM Affinity: | start /NODE [0,1,2,3] /AFFINITY [3F,FC0,3F000] |
| JVM Instances: | 12 |
| JVM Initial Heap (MB): | 2048 |
| JVM Maximum Heap (MB): | 2048 |
| JVM Address Bits: | 64 |
| Boot Firmware Version: | X10DRX5.326 |
| Management Firmware Version: | 01.91 |
| Workload Version: | SSJ 1.2.10 |
| Director Location: | Controller |
| Other Software: | IBM WebSphere Application Server V8.5.0.0, Microsoft Hotfix for Windows (KB2510206) |
| JVM Instance | ssj_ops@100% |
|---|---|
| test4.001 | 263,805 |
| test4.002 | 263,431 |
| test4.003 | 263,473 |
| test4.004 | 261,209 |
| test4.005 | 261,943 |
| test4.006 | 261,860 |
| test4.007 | 265,062 |
| test4.008 | 262,344 |
| test4.009 | 268,151 |
| test4.010 | 264,250 |
| test4.011 | 262,452 |
| test4.012 | 266,348 |
| ssj_ops@100% | 3,164,328 |
| ssj_ops@100% per JVM | 263,694 |
| Target Load | Actual Load | ssj_ops | |
|---|---|---|---|
| Target | Actual | ||
| Calibration 1 | 261,838 | ||
| Calibration 2 | 264,381 | ||
| Calibration 3 | 263,767 | ||
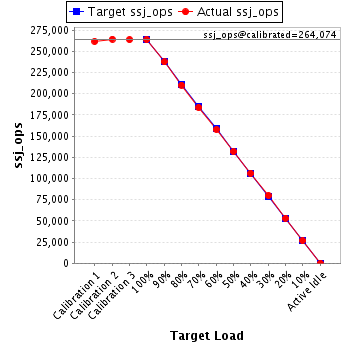
| ssj_ops@calibrated=264,074 | |||
| 100% | 99.9% | 264,074 | 263,805 |
| 90% | 89.9% | 237,666 | 237,514 |
| 80% | 79.6% | 211,259 | 210,253 |
| 70% | 69.6% | 184,852 | 183,713 |
| 60% | 59.8% | 158,444 | 157,846 |
| 50% | 50.0% | 132,037 | 131,952 |
| 40% | 40.2% | 105,629 | 106,241 |
| 30% | 30.2% | 79,222 | 79,882 |
| 20% | 20.2% | 52,815 | 53,223 |
| 10% | 10.1% | 26,407 | 26,752 |
| Active Idle | 0 | 0 | |
| Target Load | Actual Load | ssj_ops | |
|---|---|---|---|
| Target | Actual | ||
| Calibration 1 | 263,929 | ||
| Calibration 2 | 265,245 | ||
| Calibration 3 | 265,742 | ||
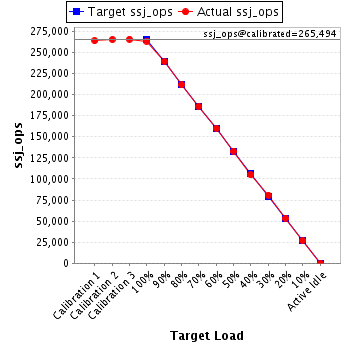
| ssj_ops@calibrated=265,494 | |||
| 100% | 99.2% | 265,494 | 263,431 |
| 90% | 90.2% | 238,944 | 239,462 |
| 80% | 79.7% | 212,395 | 211,551 |
| 70% | 70.1% | 185,846 | 186,080 |
| 60% | 60.3% | 159,296 | 160,050 |
| 50% | 50.1% | 132,747 | 133,053 |
| 40% | 39.5% | 106,198 | 104,831 |
| 30% | 30.4% | 79,648 | 80,655 |
| 20% | 20.1% | 53,099 | 53,331 |
| 10% | 10.1% | 26,549 | 26,719 |
| Active Idle | 0 | 0 | |
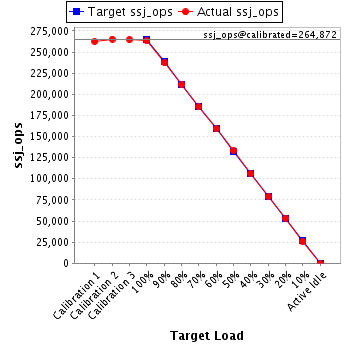
| Target Load | Actual Load | ssj_ops | |
|---|---|---|---|
| Target | Actual | ||
| Calibration 1 | 262,566 | ||
| Calibration 2 | 265,221 | ||
| Calibration 3 | 264,522 | ||
| ssj_ops@calibrated=264,872 | |||
| 100% | 99.5% | 264,872 | 263,473 |
| 90% | 89.7% | 238,384 | 237,463 |
| 80% | 79.8% | 211,897 | 211,356 |
| 70% | 69.9% | 185,410 | 185,155 |
| 60% | 60.1% | 158,923 | 159,079 |
| 50% | 50.4% | 132,436 | 133,499 |
| 40% | 40.0% | 105,949 | 105,976 |
| 30% | 29.8% | 79,461 | 78,818 |
| 20% | 20.1% | 52,974 | 53,321 |
| 10% | 9.8% | 26,487 | 26,019 |
| Active Idle | 0 | 0 | |
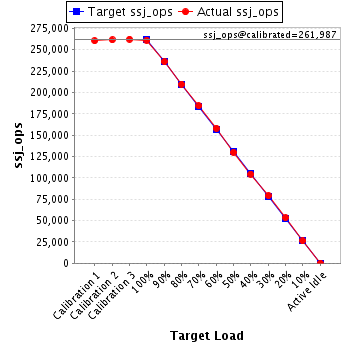
| Target Load | Actual Load | ssj_ops | |
|---|---|---|---|
| Target | Actual | ||
| Calibration 1 | 260,500 | ||
| Calibration 2 | 261,504 | ||
| Calibration 3 | 262,470 | ||
| ssj_ops@calibrated=261,987 | |||
| 100% | 99.7% | 261,987 | 261,209 |
| 90% | 90.1% | 235,788 | 236,032 |
| 80% | 80.1% | 209,590 | 209,792 |
| 70% | 70.3% | 183,391 | 184,267 |
| 60% | 60.3% | 157,192 | 158,076 |
| 50% | 49.6% | 130,993 | 129,982 |
| 40% | 39.9% | 104,795 | 104,509 |
| 30% | 30.2% | 78,596 | 79,043 |
| 20% | 20.3% | 52,397 | 53,168 |
| 10% | 10.0% | 26,199 | 26,182 |
| Active Idle | 0 | 0 | |
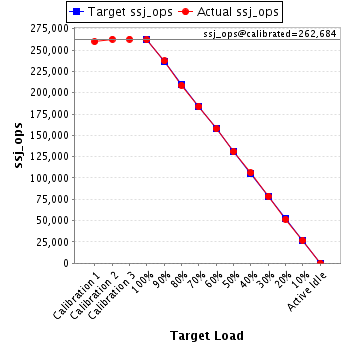
| Target Load | Actual Load | ssj_ops | |
|---|---|---|---|
| Target | Actual | ||
| Calibration 1 | 259,911 | ||
| Calibration 2 | 262,624 | ||
| Calibration 3 | 262,743 | ||
| ssj_ops@calibrated=262,684 | |||
| 100% | 99.7% | 262,684 | 261,943 |
| 90% | 90.3% | 236,415 | 237,146 |
| 80% | 79.4% | 210,147 | 208,470 |
| 70% | 70.0% | 183,878 | 183,770 |
| 60% | 60.1% | 157,610 | 157,753 |
| 50% | 49.8% | 131,342 | 130,879 |
| 40% | 40.3% | 105,073 | 105,938 |
| 30% | 29.9% | 78,805 | 78,629 |
| 20% | 19.6% | 52,537 | 51,609 |
| 10% | 10.2% | 26,268 | 26,761 |
| Active Idle | 0 | 0 | |
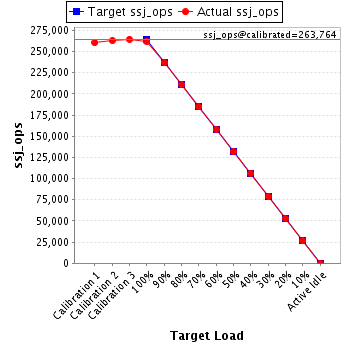
| Target Load | Actual Load | ssj_ops | |
|---|---|---|---|
| Target | Actual | ||
| Calibration 1 | 260,339 | ||
| Calibration 2 | 262,917 | ||
| Calibration 3 | 264,610 | ||
| ssj_ops@calibrated=263,764 | |||
| 100% | 99.3% | 263,764 | 261,860 |
| 90% | 89.8% | 237,387 | 236,866 |
| 80% | 79.8% | 211,011 | 210,541 |
| 70% | 70.0% | 184,635 | 184,669 |
| 60% | 60.0% | 158,258 | 158,368 |
| 50% | 49.9% | 131,882 | 131,595 |
| 40% | 40.4% | 105,505 | 106,535 |
| 30% | 29.9% | 79,129 | 78,789 |
| 20% | 20.0% | 52,753 | 52,873 |
| 10% | 10.0% | 26,376 | 26,349 |
| Active Idle | 0 | 0 | |
| Target Load | Actual Load | ssj_ops | |
|---|---|---|---|
| Target | Actual | ||
| Calibration 1 | 262,904 | ||
| Calibration 2 | 265,547 | ||
| Calibration 3 | 264,825 | ||
| ssj_ops@calibrated=265,186 | |||
| 100% | 100.0% | 265,186 | 265,062 |
| 90% | 90.0% | 238,668 | 238,782 |
| 80% | 79.7% | 212,149 | 211,316 |
| 70% | 70.0% | 185,630 | 185,519 |
| 60% | 59.7% | 159,112 | 158,299 |
| 50% | 49.9% | 132,593 | 132,459 |
| 40% | 39.8% | 106,074 | 105,465 |
| 30% | 30.3% | 79,556 | 80,266 |
| 20% | 20.2% | 53,037 | 53,620 |
| 10% | 9.9% | 26,519 | 26,348 |
| Active Idle | 0 | 0 | |

| Target Load | Actual Load | ssj_ops | |
|---|---|---|---|
| Target | Actual | ||
| Calibration 1 | 261,938 | ||
| Calibration 2 | 265,001 | ||
| Calibration 3 | 264,861 | ||
| ssj_ops@calibrated=264,931 | |||
| 100% | 99.0% | 264,931 | 262,344 |
| 90% | 89.8% | 238,438 | 237,910 |
| 80% | 80.0% | 211,944 | 211,983 |
| 70% | 70.0% | 185,451 | 185,567 |
| 60% | 59.9% | 158,958 | 158,784 |
| 50% | 49.5% | 132,465 | 131,140 |
| 40% | 39.6% | 105,972 | 104,925 |
| 30% | 30.0% | 79,479 | 79,481 |
| 20% | 20.3% | 52,986 | 53,674 |
| 10% | 10.0% | 26,493 | 26,448 |
| Active Idle | 0 | 0 | |

| Target Load | Actual Load | ssj_ops | |
|---|---|---|---|
| Target | Actual | ||
| Calibration 1 | 266,794 | ||
| Calibration 2 | 269,755 | ||
| Calibration 3 | 268,737 | ||
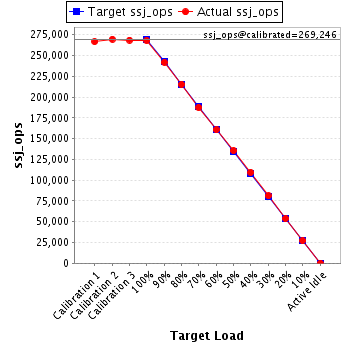
| ssj_ops@calibrated=269,246 | |||
| 100% | 99.6% | 269,246 | 268,151 |
| 90% | 89.9% | 242,322 | 242,038 |
| 80% | 80.0% | 215,397 | 215,392 |
| 70% | 69.6% | 188,472 | 187,519 |
| 60% | 59.7% | 161,548 | 160,767 |
| 50% | 50.3% | 134,623 | 135,515 |
| 40% | 40.7% | 107,699 | 109,522 |
| 30% | 30.1% | 80,774 | 81,149 |
| 20% | 20.0% | 53,849 | 53,777 |
| 10% | 10.1% | 26,925 | 27,198 |
| Active Idle | 0 | 0 | |
| Target Load | Actual Load | ssj_ops | |
|---|---|---|---|
| Target | Actual | ||
| Calibration 1 | 262,487 | ||
| Calibration 2 | 265,496 | ||
| Calibration 3 | 265,728 | ||
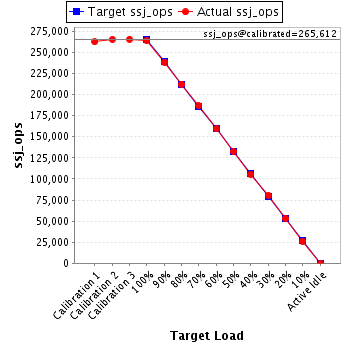
| ssj_ops@calibrated=265,612 | |||
| 100% | 99.5% | 265,612 | 264,250 |
| 90% | 89.8% | 239,051 | 238,562 |
| 80% | 79.9% | 212,490 | 212,347 |
| 70% | 70.3% | 185,928 | 186,627 |
| 60% | 60.0% | 159,367 | 159,414 |
| 50% | 49.9% | 132,806 | 132,581 |
| 40% | 39.8% | 106,245 | 105,756 |
| 30% | 30.2% | 79,684 | 80,267 |
| 20% | 20.0% | 53,122 | 53,187 |
| 10% | 9.9% | 26,561 | 26,369 |
| Active Idle | 0 | 0 | |
| Target Load | Actual Load | ssj_ops | |
|---|---|---|---|
| Target | Actual | ||
| Calibration 1 | 261,832 | ||
| Calibration 2 | 264,110 | ||
| Calibration 3 | 264,729 | ||
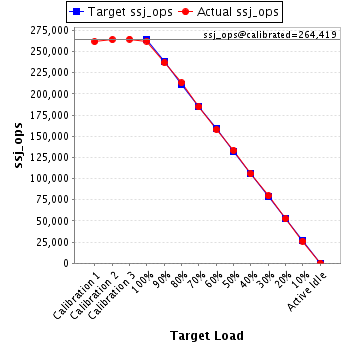
| ssj_ops@calibrated=264,419 | |||
| 100% | 99.3% | 264,419 | 262,452 |
| 90% | 89.6% | 237,977 | 236,968 |
| 80% | 80.6% | 211,535 | 213,108 |
| 70% | 69.9% | 185,094 | 184,714 |
| 60% | 59.7% | 158,652 | 157,953 |
| 50% | 50.4% | 132,210 | 133,299 |
| 40% | 39.9% | 105,768 | 105,519 |
| 30% | 30.1% | 79,326 | 79,506 |
| 20% | 19.8% | 52,884 | 52,472 |
| 10% | 9.9% | 26,442 | 26,211 |
| Active Idle | 0 | 0 | |
| Target Load | Actual Load | ssj_ops | |
|---|---|---|---|
| Target | Actual | ||
| Calibration 1 | 263,554 | ||
| Calibration 2 | 265,818 | ||
| Calibration 3 | 266,202 | ||
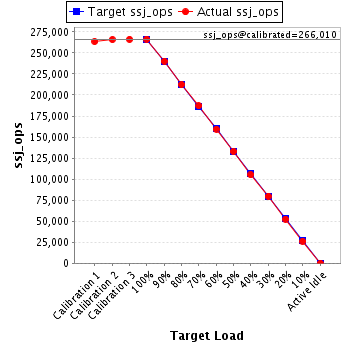
| ssj_ops@calibrated=266,010 | |||
| 100% | 100.1% | 266,010 | 266,348 |
| 90% | 90.3% | 239,409 | 240,225 |
| 80% | 79.8% | 212,808 | 212,152 |
| 70% | 70.3% | 186,207 | 187,052 |
| 60% | 60.0% | 159,606 | 159,571 |
| 50% | 50.0% | 133,005 | 133,098 |
| 40% | 39.5% | 106,404 | 105,031 |
| 30% | 30.0% | 79,803 | 79,755 |
| 20% | 19.8% | 53,202 | 52,571 |
| 10% | 9.9% | 26,601 | 26,256 |
| Active Idle | 0 | 0 | |