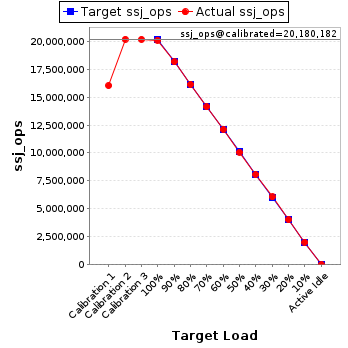
| Target Load |
Actual Load |
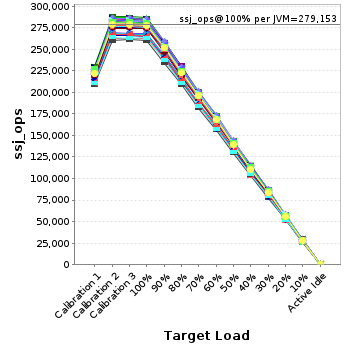
ssj_ops |
| Target |
Actual |
| Calibration 1 |
|
|
16,032,229 |
| Calibration 2 |
|
|
20,185,730 |
| Calibration 3 |
|
|
20,174,634 |
| ssj_ops@calibrated=20,180,182 |
| 100% |
99.6% |
20,180,182 |
20,099,043 |
| 90% |
90.0% |
18,162,164 |
18,160,542 |
| 80% |
80.0% |
16,144,146 |
16,144,293 |
| 70% |
70.0% |
14,126,127 |
14,131,382 |
| 60% |
60.0% |
12,108,109 |
12,115,807 |
| 50% |
50.0% |
10,090,091 |
10,080,251 |
| 40% |
40.0% |
8,072,073 |
8,069,587 |
| 30% |
30.0% |
6,054,055 |
6,061,721 |
| 20% |
20.0% |
4,036,036 |
4,026,010 |
| 10% |
10.0% |
2,018,018 |
2,016,482 |
| Active Idle |
|
0 |
0 |
| Hardware |
| Hardware Vendor: |
Hewlett Packard Enterprise |
| Model: |
ProLiant Compute DL360 Gen12 |
| Form Factor: |
1U |
| CPU Name: |
Intel Xeon 6780E 2.2 GHz |
| CPU Characteristics: |
144 core, 2.2GHz, 108MB L3 Cache |
| CPU Frequency (MHz): |
2200 |
| CPU(s) Enabled: |
288 cores, 2 chips, 144 cores/chip |
| Hardware Threads: |
288 (1 / core) |
| CPU(s) Orderable: |
1,2 chip |
| Primary Cache: |
32 KB I + 48 KB D on chip per core |
| Secondary Cache: |
4 MB I+D on chip per core |
| Tertiary Cache: |
108 MB I+D on chip per chip |
| Other Cache: |
None |
| Memory Amount (GB): |
512 |
| # and size of DIMM: |
16 x 32768 MB |
| Memory Details: |
32 GB 2Rx8 PC5-5600; slots 1, 3, 5, 7, 10, 12, 14 & 16 on each socket |
| Power Supply Quantity and Rating (W): |
1 x 1000 |
| Power Supply Details: |
HPE 1000W Flex Slot Titanium Hot Plug Power Supply Kit 96% (P03178-B21) |
| Disk Drive: |
1 x HPE 1.6tb Nvme High Performance Mixed Use Sff Sc U.3 Tlc SSD |
| Disk Controller: |
Embedded SATA |
| # and type of Network Interface Cards (NICs) Installed: |
1 x BCM 5719 1Gb 4p BASE-T OCP Adptr (P51178-B21) |
| NICs Enabled in Firmware / OS / Connected: |
4/4/1 |
| Network Speed (Mbit): |
1000 |
| Keyboard: |
None |
| Mouse: |
None |
| Monitor: |
None |
| Optical Drives: |
No |
| Other Hardware: |
None |
| JVM Instance |
ssj_ops@100% |
| localhost.001 |
262,415 |
| localhost.002 |
267,753 |
| localhost.003 |
285,101 |
| localhost.004 |
283,824 |
| localhost.005 |
280,696 |
| localhost.006 |
280,627 |
| localhost.007 |
285,260 |
| localhost.008 |
283,300 |
| localhost.009 |
280,214 |
| localhost.010 |
282,700 |
| localhost.011 |
282,581 |
| localhost.012 |
275,742 |
| localhost.013 |
282,213 |
| localhost.014 |
267,027 |
| localhost.015 |
260,061 |
| localhost.016 |
279,917 |
| localhost.017 |
280,804 |
| localhost.018 |
282,439 |
| localhost.019 |
280,045 |
| localhost.020 |
277,437 |
| localhost.021 |
274,997 |
| localhost.022 |
283,963 |
| localhost.023 |
282,544 |
| localhost.024 |
273,928 |
| localhost.025 |
286,448 |
| localhost.026 |
281,689 |
| localhost.027 |
278,546 |
| localhost.028 |
281,349 |
| localhost.029 |
281,795 |
| localhost.030 |
276,611 |
| localhost.031 |
283,098 |
| localhost.032 |
280,767 |
| localhost.033 |
278,073 |
| localhost.034 |
280,376 |
| localhost.035 |
278,785 |
| localhost.036 |
277,390 |
| localhost.037 |
278,445 |
| localhost.038 |
278,704 |
| localhost.039 |
282,936 |
| localhost.040 |
280,571 |
| localhost.041 |
280,403 |
| localhost.042 |
283,680 |
| localhost.043 |
284,276 |
| localhost.044 |
264,633 |
| localhost.045 |
284,192 |
| localhost.046 |
278,690 |
| localhost.047 |
282,966 |
| localhost.048 |
277,444 |
| localhost.049 |
282,695 |
| localhost.050 |
265,171 |
| localhost.051 |
276,550 |
| localhost.052 |
281,228 |
| localhost.053 |
282,806 |
| localhost.054 |
284,046 |
| localhost.055 |
263,097 |
| localhost.056 |
279,536 |
| localhost.057 |
273,707 |
| localhost.058 |
283,966 |
| localhost.059 |
281,310 |
| localhost.060 |
280,029 |
| localhost.061 |
282,769 |
| localhost.062 |
280,640 |
| localhost.063 |
278,946 |
| localhost.064 |
284,884 |
| localhost.065 |
282,097 |
| localhost.066 |
278,609 |
| localhost.067 |
281,757 |
| localhost.068 |
281,695 |
| localhost.069 |
276,654 |
| localhost.070 |
281,861 |
| localhost.071 |
280,055 |
| localhost.072 |
277,478 |
| ssj_ops@100% |
20,099,043 |
| ssj_ops@100% per JVM |
279,153 |
JVM 'localhost.001' Scores:
| Target Load |
Actual Load |
ssj_ops |
| Target |
Actual |
| Calibration 1 |
|
|
210,341 |
| Calibration 2 |
|
|
262,987 |
| Calibration 3 |
|
|
262,916 |
| ssj_ops@calibrated=262,951 |
| 100% |
99.8% |
262,951 |
262,415 |
| 90% |
90.5% |
236,656 |
237,886 |
| 80% |
79.9% |
210,361 |
210,023 |
| 70% |
70.0% |
184,066 |
184,190 |
| 60% |
60.1% |
157,771 |
158,054 |
| 50% |
50.1% |
131,476 |
131,745 |
| 40% |
39.9% |
105,180 |
104,945 |
| 30% |
30.0% |
78,885 |
79,013 |
| 20% |
20.1% |
52,590 |
52,919 |
| 10% |
10.1% |
26,295 |
26,467 |
| Active Idle |
|
0 |
0 |
JVM 'localhost.002' Scores:
| Target Load |
Actual Load |
ssj_ops |
| Target |
Actual |
| Calibration 1 |
|
|
216,595 |
| Calibration 2 |
|
|
269,235 |
| Calibration 3 |
|
|
268,258 |
| ssj_ops@calibrated=268,747 |
| 100% |
99.6% |
268,747 |
267,753 |
| 90% |
90.1% |
241,872 |
242,181 |
| 80% |
80.2% |
214,997 |
215,542 |
| 70% |
69.7% |
188,123 |
187,364 |
| 60% |
60.0% |
161,248 |
161,308 |
| 50% |
50.2% |
134,373 |
134,904 |
| 40% |
40.0% |
107,499 |
107,569 |
| 30% |
30.0% |
80,624 |
80,703 |
| 20% |
19.9% |
53,749 |
53,566 |
| 10% |
10.0% |
26,875 |
26,984 |
| Active Idle |
|
0 |
0 |
JVM 'localhost.003' Scores:
| Target Load |
Actual Load |
ssj_ops |
| Target |
Actual |
| Calibration 1 |
|
|
225,636 |
| Calibration 2 |
|
|
285,869 |
| Calibration 3 |
|
|
285,242 |
| ssj_ops@calibrated=285,556 |
| 100% |
99.8% |
285,556 |
285,101 |
| 90% |
90.1% |
257,000 |
257,231 |
| 80% |
79.7% |
228,444 |
227,489 |
| 70% |
70.4% |
199,889 |
200,935 |
| 60% |
59.8% |
171,333 |
170,713 |
| 50% |
49.9% |
142,778 |
142,600 |
| 40% |
40.2% |
114,222 |
114,838 |
| 30% |
29.9% |
85,667 |
85,271 |
| 20% |
20.3% |
57,111 |
58,016 |
| 10% |
9.9% |
28,556 |
28,200 |
| Active Idle |
|
0 |
0 |
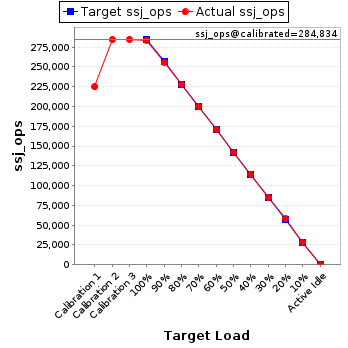
JVM 'localhost.004' Scores:
| Target Load |
Actual Load |
ssj_ops |
| Target |
Actual |
| Calibration 1 |
|
|
224,777 |
| Calibration 2 |
|
|
284,634 |
| Calibration 3 |
|
|
285,034 |
| ssj_ops@calibrated=284,834 |
| 100% |
99.6% |
284,834 |
283,824 |
| 90% |
89.8% |
256,351 |
255,753 |
| 80% |
79.9% |
227,867 |
227,716 |
| 70% |
70.2% |
199,384 |
199,907 |
| 60% |
60.0% |
170,900 |
170,790 |
| 50% |
49.9% |
142,417 |
142,233 |
| 40% |
40.1% |
113,934 |
114,188 |
| 30% |
29.9% |
85,450 |
85,213 |
| 20% |
20.3% |
56,967 |
57,798 |
| 10% |
9.9% |
28,483 |
28,188 |
| Active Idle |
|
0 |
0 |
JVM 'localhost.005' Scores:
| Target Load |
Actual Load |
ssj_ops |
| Target |
Actual |
| Calibration 1 |
|
|
225,032 |
| Calibration 2 |
|
|
281,549 |
| Calibration 3 |
|
|
282,144 |
| ssj_ops@calibrated=281,846 |
| 100% |
99.6% |
281,846 |
280,696 |
| 90% |
89.6% |
253,662 |
252,617 |
| 80% |
79.9% |
225,477 |
225,332 |
| 70% |
70.0% |
197,292 |
197,187 |
| 60% |
59.8% |
169,108 |
168,494 |
| 50% |
50.0% |
140,923 |
140,912 |
| 40% |
40.1% |
112,739 |
113,110 |
| 30% |
29.8% |
84,554 |
83,998 |
| 20% |
19.9% |
56,369 |
56,033 |
| 10% |
9.9% |
28,185 |
27,983 |
| Active Idle |
|
0 |
0 |
JVM 'localhost.006' Scores:
| Target Load |
Actual Load |
ssj_ops |
| Target |
Actual |
| Calibration 1 |
|
|
222,118 |
| Calibration 2 |
|
|
281,924 |
| Calibration 3 |
|
|
282,201 |
| ssj_ops@calibrated=282,063 |
| 100% |
99.5% |
282,063 |
280,627 |
| 90% |
90.0% |
253,856 |
253,875 |
| 80% |
80.1% |
225,650 |
225,799 |
| 70% |
70.3% |
197,444 |
198,230 |
| 60% |
59.8% |
169,238 |
168,788 |
| 50% |
49.7% |
141,031 |
140,193 |
| 40% |
40.0% |
112,825 |
112,850 |
| 30% |
30.3% |
84,619 |
85,496 |
| 20% |
20.0% |
56,413 |
56,395 |
| 10% |
9.8% |
28,206 |
27,736 |
| Active Idle |
|
0 |
0 |
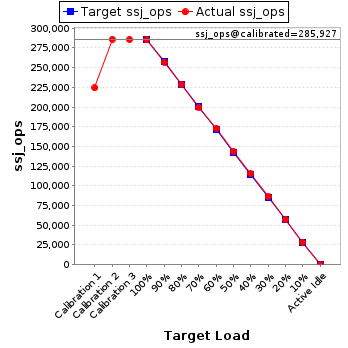
JVM 'localhost.007' Scores:
| Target Load |
Actual Load |
ssj_ops |
| Target |
Actual |
| Calibration 1 |
|
|
224,254 |
| Calibration 2 |
|
|
286,077 |
| Calibration 3 |
|
|
285,776 |
| ssj_ops@calibrated=285,927 |
| 100% |
99.8% |
285,927 |
285,260 |
| 90% |
89.9% |
257,334 |
257,157 |
| 80% |
80.0% |
228,741 |
228,655 |
| 70% |
70.0% |
200,149 |
200,084 |
| 60% |
60.5% |
171,556 |
172,894 |
| 50% |
50.1% |
142,963 |
143,144 |
| 40% |
40.4% |
114,371 |
115,464 |
| 30% |
30.1% |
85,778 |
86,068 |
| 20% |
20.0% |
57,185 |
57,278 |
| 10% |
10.0% |
28,593 |
28,570 |
| Active Idle |
|
0 |
0 |
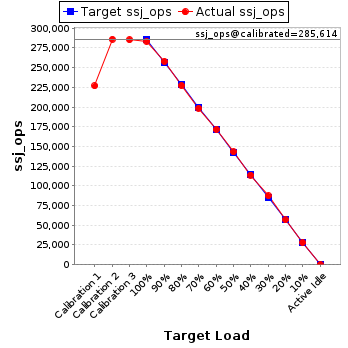
JVM 'localhost.008' Scores:
| Target Load |
Actual Load |
ssj_ops |
| Target |
Actual |
| Calibration 1 |
|
|
226,749 |
| Calibration 2 |
|
|
286,033 |
| Calibration 3 |
|
|
285,194 |
| ssj_ops@calibrated=285,614 |
| 100% |
99.2% |
285,614 |
283,300 |
| 90% |
90.3% |
257,053 |
257,924 |
| 80% |
79.5% |
228,491 |
227,080 |
| 70% |
69.5% |
199,930 |
198,590 |
| 60% |
60.1% |
171,368 |
171,647 |
| 50% |
50.1% |
142,807 |
142,988 |
| 40% |
39.8% |
114,246 |
113,691 |
| 30% |
30.6% |
85,684 |
87,318 |
| 20% |
19.8% |
57,123 |
56,693 |
| 10% |
9.9% |
28,561 |
28,150 |
| Active Idle |
|
0 |
0 |
JVM 'localhost.009' Scores:
| Target Load |
Actual Load |
ssj_ops |
| Target |
Actual |
| Calibration 1 |
|
|
226,555 |
| Calibration 2 |
|
|
281,143 |
| Calibration 3 |
|
|
281,034 |
| ssj_ops@calibrated=281,088 |
| 100% |
99.7% |
281,088 |
280,214 |
| 90% |
89.4% |
252,980 |
251,382 |
| 80% |
79.9% |
224,871 |
224,647 |
| 70% |
70.3% |
196,762 |
197,502 |
| 60% |
59.9% |
168,653 |
168,482 |
| 50% |
49.8% |
140,544 |
140,052 |
| 40% |
40.0% |
112,435 |
112,373 |
| 30% |
29.8% |
84,327 |
83,718 |
| 20% |
20.0% |
56,218 |
56,202 |
| 10% |
9.8% |
28,109 |
27,604 |
| Active Idle |
|
0 |
0 |
JVM 'localhost.010' Scores:
| Target Load |
Actual Load |
ssj_ops |
| Target |
Actual |
| Calibration 1 |
|
|
225,916 |
| Calibration 2 |
|
|
284,314 |
| Calibration 3 |
|
|
284,078 |
| ssj_ops@calibrated=284,196 |
| 100% |
99.5% |
284,196 |
282,700 |
| 90% |
90.3% |
255,777 |
256,488 |
| 80% |
80.0% |
227,357 |
227,364 |
| 70% |
69.3% |
198,937 |
196,951 |
| 60% |
60.0% |
170,518 |
170,461 |
| 50% |
50.4% |
142,098 |
143,170 |
| 40% |
40.4% |
113,678 |
114,842 |
| 30% |
29.9% |
85,259 |
84,850 |
| 20% |
19.8% |
56,839 |
56,401 |
| 10% |
10.1% |
28,420 |
28,757 |
| Active Idle |
|
0 |
0 |
JVM 'localhost.011' Scores:
| Target Load |
Actual Load |
ssj_ops |
| Target |
Actual |
| Calibration 1 |
|
|
225,294 |
| Calibration 2 |
|
|
284,262 |
| Calibration 3 |
|
|
284,546 |
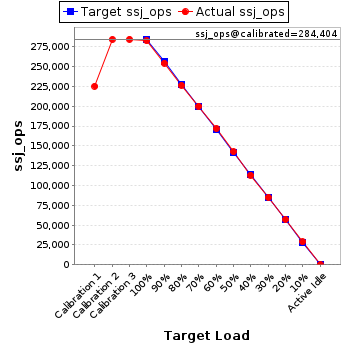
| ssj_ops@calibrated=284,404 |
| 100% |
99.4% |
284,404 |
282,581 |
| 90% |
89.5% |
255,964 |
254,412 |
| 80% |
79.6% |
227,523 |
226,306 |
| 70% |
70.3% |
199,083 |
200,023 |
| 60% |
60.4% |
170,642 |
171,861 |
| 50% |
50.1% |
142,202 |
142,499 |
| 40% |
39.7% |
113,762 |
112,809 |
| 30% |
29.9% |
85,321 |
84,958 |
| 20% |
20.1% |
56,881 |
57,127 |
| 10% |
10.1% |
28,440 |
28,687 |
| Active Idle |
|
0 |
0 |
JVM 'localhost.012' Scores:
| Target Load |
Actual Load |
ssj_ops |
| Target |
Actual |
| Calibration 1 |
|
|
223,813 |
| Calibration 2 |
|
|
277,092 |
| Calibration 3 |
|
|
277,069 |
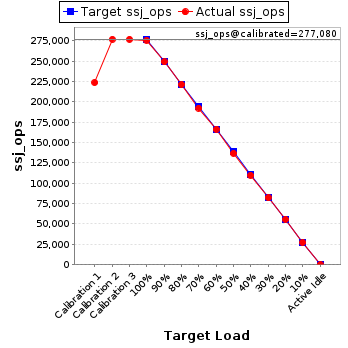
| ssj_ops@calibrated=277,080 |
| 100% |
99.5% |
277,080 |
275,742 |
| 90% |
90.0% |
249,372 |
249,240 |
| 80% |
79.8% |
221,664 |
221,237 |
| 70% |
69.5% |
193,956 |
192,442 |
| 60% |
60.1% |
166,248 |
166,556 |
| 50% |
49.4% |
138,540 |
136,901 |
| 40% |
39.6% |
110,832 |
109,670 |
| 30% |
29.7% |
83,124 |
82,157 |
| 20% |
20.1% |
55,416 |
55,800 |
| 10% |
9.9% |
27,708 |
27,429 |
| Active Idle |
|
0 |
0 |
JVM 'localhost.013' Scores:
| Target Load |
Actual Load |
ssj_ops |
| Target |
Actual |
| Calibration 1 |
|
|
224,369 |
| Calibration 2 |
|
|
283,711 |
| Calibration 3 |
|
|
282,852 |
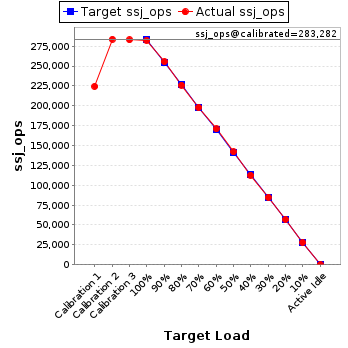
| ssj_ops@calibrated=283,282 |
| 100% |
99.6% |
283,282 |
282,213 |
| 90% |
90.2% |
254,953 |
255,444 |
| 80% |
79.8% |
226,625 |
226,065 |
| 70% |
69.8% |
198,297 |
197,846 |
| 60% |
60.3% |
169,969 |
170,816 |
| 50% |
50.1% |
141,641 |
141,802 |
| 40% |
39.7% |
113,313 |
112,451 |
| 30% |
29.9% |
84,984 |
84,721 |
| 20% |
20.1% |
56,656 |
56,920 |
| 10% |
9.9% |
28,328 |
28,083 |
| Active Idle |
|
0 |
0 |
JVM 'localhost.014' Scores:
| Target Load |
Actual Load |
ssj_ops |
| Target |
Actual |
| Calibration 1 |
|
|
213,122 |
| Calibration 2 |
|
|
267,707 |
| Calibration 3 |
|
|
267,459 |
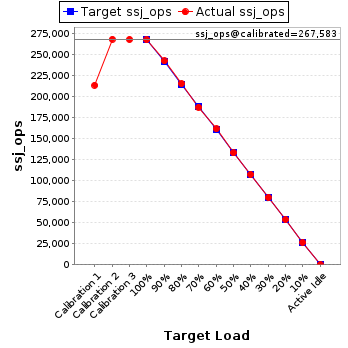
| ssj_ops@calibrated=267,583 |
| 100% |
99.8% |
267,583 |
267,027 |
| 90% |
90.4% |
240,825 |
241,911 |
| 80% |
80.3% |
214,066 |
214,974 |
| 70% |
69.8% |
187,308 |
186,900 |
| 60% |
60.3% |
160,550 |
161,291 |
| 50% |
49.6% |
133,792 |
132,701 |
| 40% |
40.0% |
107,033 |
107,009 |
| 30% |
29.8% |
80,275 |
79,821 |
| 20% |
20.0% |
53,517 |
53,488 |
| 10% |
9.9% |
26,758 |
26,498 |
| Active Idle |
|
0 |
0 |
JVM 'localhost.015' Scores:
| Target Load |
Actual Load |
ssj_ops |
| Target |
Actual |
| Calibration 1 |
|
|
208,915 |
| Calibration 2 |
|
|
260,009 |
| Calibration 3 |
|
|
260,767 |
| ssj_ops@calibrated=260,388 |
| 100% |
99.9% |
260,388 |
260,061 |
| 90% |
89.8% |
234,349 |
233,855 |
| 80% |
80.1% |
208,310 |
208,597 |
| 70% |
69.8% |
182,271 |
181,736 |
| 60% |
60.0% |
156,233 |
156,245 |
| 50% |
49.7% |
130,194 |
129,533 |
| 40% |
39.9% |
104,155 |
103,957 |
| 30% |
29.5% |
78,116 |
76,840 |
| 20% |
20.0% |
52,078 |
52,052 |
| 10% |
9.8% |
26,039 |
25,467 |
| Active Idle |
|
0 |
0 |
JVM 'localhost.016' Scores:
| Target Load |
Actual Load |
ssj_ops |
| Target |
Actual |
| Calibration 1 |
|
|
222,381 |
| Calibration 2 |
|
|
281,478 |
| Calibration 3 |
|
|
281,437 |
| ssj_ops@calibrated=281,458 |
| 100% |
99.5% |
281,458 |
279,917 |
| 90% |
90.1% |
253,312 |
253,610 |
| 80% |
80.1% |
225,166 |
225,318 |
| 70% |
69.8% |
197,020 |
196,403 |
| 60% |
60.1% |
168,875 |
169,271 |
| 50% |
49.8% |
140,729 |
140,090 |
| 40% |
39.8% |
112,583 |
111,982 |
| 30% |
30.1% |
84,437 |
84,752 |
| 20% |
19.7% |
56,292 |
55,583 |
| 10% |
10.1% |
28,146 |
28,294 |
| Active Idle |
|
0 |
0 |
JVM 'localhost.017' Scores:
| Target Load |
Actual Load |
ssj_ops |
| Target |
Actual |
| Calibration 1 |
|
|
222,765 |
| Calibration 2 |
|
|
281,675 |
| Calibration 3 |
|
|
281,642 |
| ssj_ops@calibrated=281,658 |
| 100% |
99.7% |
281,658 |
280,804 |
| 90% |
90.0% |
253,492 |
253,622 |
| 80% |
80.3% |
225,327 |
226,073 |
| 70% |
70.1% |
197,161 |
197,313 |
| 60% |
60.1% |
168,995 |
169,194 |
| 50% |
50.1% |
140,829 |
141,207 |
| 40% |
40.1% |
112,663 |
112,920 |
| 30% |
30.1% |
84,497 |
84,791 |
| 20% |
19.9% |
56,332 |
56,165 |
| 10% |
10.0% |
28,166 |
28,067 |
| Active Idle |
|
0 |
0 |
JVM 'localhost.018' Scores:
| Target Load |
Actual Load |
ssj_ops |
| Target |
Actual |
| Calibration 1 |
|
|
225,903 |
| Calibration 2 |
|
|
282,880 |
| Calibration 3 |
|
|
283,018 |
| ssj_ops@calibrated=282,949 |
| 100% |
99.8% |
282,949 |
282,439 |
| 90% |
89.9% |
254,654 |
254,494 |
| 80% |
79.8% |
226,359 |
225,806 |
| 70% |
69.7% |
198,064 |
197,317 |
| 60% |
60.3% |
169,769 |
170,707 |
| 50% |
49.7% |
141,475 |
140,565 |
| 40% |
39.5% |
113,180 |
111,758 |
| 30% |
30.0% |
84,885 |
84,901 |
| 20% |
19.7% |
56,590 |
55,641 |
| 10% |
10.0% |
28,295 |
28,355 |
| Active Idle |
|
0 |
0 |
JVM 'localhost.019' Scores:
| Target Load |
Actual Load |
ssj_ops |
| Target |
Actual |
| Calibration 1 |
|
|
222,199 |
| Calibration 2 |
|
|
281,061 |
| Calibration 3 |
|
|
280,918 |
| ssj_ops@calibrated=280,989 |
| 100% |
99.7% |
280,989 |
280,045 |
| 90% |
90.9% |
252,891 |
255,455 |
| 80% |
80.6% |
224,792 |
226,567 |
| 70% |
69.9% |
196,693 |
196,398 |
| 60% |
59.8% |
168,594 |
167,949 |
| 50% |
50.1% |
140,495 |
140,768 |
| 40% |
39.8% |
112,396 |
111,745 |
| 30% |
29.6% |
84,297 |
83,293 |
| 20% |
19.7% |
56,198 |
55,238 |
| 10% |
9.9% |
28,099 |
27,729 |
| Active Idle |
|
0 |
0 |
JVM 'localhost.020' Scores:
| Target Load |
Actual Load |
ssj_ops |
| Target |
Actual |
| Calibration 1 |
|
|
220,920 |
| Calibration 2 |
|
|
278,651 |
| Calibration 3 |
|
|
278,275 |
| ssj_ops@calibrated=278,463 |
| 100% |
99.6% |
278,463 |
277,437 |
| 90% |
89.7% |
250,616 |
249,801 |
| 80% |
80.0% |
222,770 |
222,839 |
| 70% |
70.2% |
194,924 |
195,428 |
| 60% |
59.7% |
167,078 |
166,126 |
| 50% |
49.7% |
139,231 |
138,399 |
| 40% |
39.9% |
111,385 |
111,103 |
| 30% |
30.6% |
83,539 |
85,283 |
| 20% |
20.2% |
55,693 |
56,251 |
| 10% |
10.0% |
27,846 |
27,827 |
| Active Idle |
|
0 |
0 |
JVM 'localhost.021' Scores:
| Target Load |
Actual Load |
ssj_ops |
| Target |
Actual |
| Calibration 1 |
|
|
217,246 |
| Calibration 2 |
|
|
276,737 |
| Calibration 3 |
|
|
276,612 |
| ssj_ops@calibrated=276,675 |
| 100% |
99.4% |
276,675 |
274,997 |
| 90% |
90.4% |
249,007 |
250,188 |
| 80% |
79.9% |
221,340 |
221,178 |
| 70% |
69.5% |
193,672 |
192,203 |
| 60% |
60.1% |
166,005 |
166,245 |
| 50% |
50.1% |
138,337 |
138,512 |
| 40% |
39.6% |
110,670 |
109,583 |
| 30% |
30.1% |
83,002 |
83,303 |
| 20% |
19.8% |
55,335 |
54,826 |
| 10% |
9.9% |
27,667 |
27,278 |
| Active Idle |
|
0 |
0 |
JVM 'localhost.022' Scores:
| Target Load |
Actual Load |
ssj_ops |
| Target |
Actual |
| Calibration 1 |
|
|
225,328 |
| Calibration 2 |
|
|
286,039 |
| Calibration 3 |
|
|
285,755 |
| ssj_ops@calibrated=285,897 |
| 100% |
99.3% |
285,897 |
283,963 |
| 90% |
90.1% |
257,307 |
257,625 |
| 80% |
80.2% |
228,717 |
229,152 |
| 70% |
70.0% |
200,128 |
200,183 |
| 60% |
60.3% |
171,538 |
172,281 |
| 50% |
49.8% |
142,948 |
142,434 |
| 40% |
39.7% |
114,359 |
113,596 |
| 30% |
30.0% |
85,769 |
85,774 |
| 20% |
20.0% |
57,179 |
57,157 |
| 10% |
10.1% |
28,590 |
28,912 |
| Active Idle |
|
0 |
0 |
JVM 'localhost.023' Scores:
| Target Load |
Actual Load |
ssj_ops |
| Target |
Actual |
| Calibration 1 |
|
|
224,184 |
| Calibration 2 |
|
|
283,831 |
| Calibration 3 |
|
|
283,578 |
| ssj_ops@calibrated=283,704 |
| 100% |
99.6% |
283,704 |
282,544 |
| 90% |
90.0% |
255,334 |
255,298 |
| 80% |
80.0% |
226,964 |
226,969 |
| 70% |
70.0% |
198,593 |
198,653 |
| 60% |
59.7% |
170,223 |
169,267 |
| 50% |
50.1% |
141,852 |
142,258 |
| 40% |
40.1% |
113,482 |
113,871 |
| 30% |
30.1% |
85,111 |
85,294 |
| 20% |
19.6% |
56,741 |
55,556 |
| 10% |
10.1% |
28,370 |
28,631 |
| Active Idle |
|
0 |
0 |
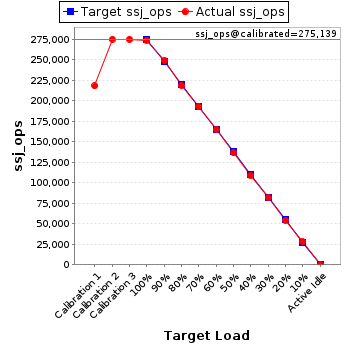
JVM 'localhost.024' Scores:
| Target Load |
Actual Load |
ssj_ops |
| Target |
Actual |
| Calibration 1 |
|
|
218,262 |
| Calibration 2 |
|
|
275,045 |
| Calibration 3 |
|
|
275,234 |
| ssj_ops@calibrated=275,139 |
| 100% |
99.6% |
275,139 |
273,928 |
| 90% |
90.5% |
247,625 |
249,119 |
| 80% |
79.6% |
220,111 |
218,909 |
| 70% |
70.3% |
192,597 |
193,329 |
| 60% |
60.1% |
165,084 |
165,489 |
| 50% |
49.7% |
137,570 |
136,613 |
| 40% |
39.7% |
110,056 |
109,241 |
| 30% |
29.7% |
82,542 |
81,823 |
| 20% |
19.8% |
55,028 |
54,370 |
| 10% |
10.1% |
27,514 |
27,851 |
| Active Idle |
|
0 |
0 |
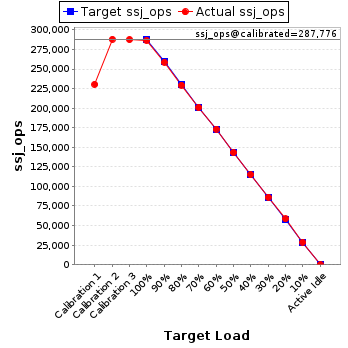
JVM 'localhost.025' Scores:
| Target Load |
Actual Load |
ssj_ops |
| Target |
Actual |
| Calibration 1 |
|
|
230,431 |
| Calibration 2 |
|
|
288,049 |
| Calibration 3 |
|
|
287,504 |
| ssj_ops@calibrated=287,776 |
| 100% |
99.5% |
287,776 |
286,448 |
| 90% |
89.9% |
258,999 |
258,748 |
| 80% |
79.8% |
230,221 |
229,534 |
| 70% |
69.8% |
201,443 |
200,902 |
| 60% |
60.2% |
172,666 |
173,347 |
| 50% |
49.8% |
143,888 |
143,447 |
| 40% |
39.9% |
115,111 |
114,882 |
| 30% |
30.0% |
86,333 |
86,253 |
| 20% |
20.3% |
57,555 |
58,453 |
| 10% |
10.0% |
28,778 |
28,850 |
| Active Idle |
|
0 |
0 |
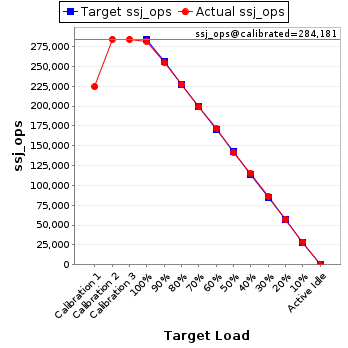
JVM 'localhost.026' Scores:
| Target Load |
Actual Load |
ssj_ops |
| Target |
Actual |
| Calibration 1 |
|
|
224,230 |
| Calibration 2 |
|
|
284,219 |
| Calibration 3 |
|
|
284,143 |
| ssj_ops@calibrated=284,181 |
| 100% |
99.1% |
284,181 |
281,689 |
| 90% |
89.6% |
255,763 |
254,497 |
| 80% |
80.0% |
227,345 |
227,320 |
| 70% |
70.0% |
198,927 |
198,799 |
| 60% |
60.5% |
170,509 |
171,985 |
| 50% |
49.9% |
142,091 |
141,917 |
| 40% |
40.6% |
113,673 |
115,243 |
| 30% |
30.2% |
85,254 |
85,957 |
| 20% |
20.1% |
56,836 |
57,111 |
| 10% |
10.0% |
28,418 |
28,493 |
| Active Idle |
|
0 |
0 |
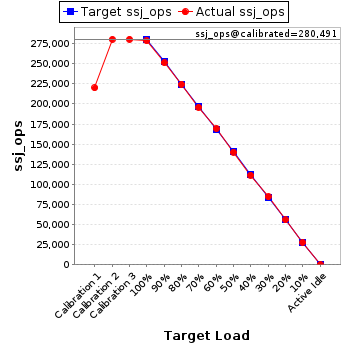
JVM 'localhost.027' Scores:
| Target Load |
Actual Load |
ssj_ops |
| Target |
Actual |
| Calibration 1 |
|
|
219,986 |
| Calibration 2 |
|
|
280,412 |
| Calibration 3 |
|
|
280,569 |
| ssj_ops@calibrated=280,491 |
| 100% |
99.3% |
280,491 |
278,546 |
| 90% |
89.6% |
252,442 |
251,273 |
| 80% |
80.0% |
224,393 |
224,495 |
| 70% |
69.8% |
196,344 |
195,858 |
| 60% |
60.4% |
168,294 |
169,398 |
| 50% |
50.0% |
140,245 |
140,184 |
| 40% |
39.7% |
112,196 |
111,248 |
| 30% |
30.1% |
84,147 |
84,454 |
| 20% |
19.8% |
56,098 |
55,628 |
| 10% |
9.9% |
28,049 |
27,841 |
| Active Idle |
|
0 |
0 |
JVM 'localhost.028' Scores:
| Target Load |
Actual Load |
ssj_ops |
| Target |
Actual |
| Calibration 1 |
|
|
222,162 |
| Calibration 2 |
|
|
282,600 |
| Calibration 3 |
|
|
282,330 |
| ssj_ops@calibrated=282,465 |
| 100% |
99.6% |
282,465 |
281,349 |
| 90% |
90.3% |
254,218 |
255,032 |
| 80% |
80.0% |
225,972 |
226,084 |
| 70% |
70.2% |
197,725 |
198,225 |
| 60% |
59.9% |
169,479 |
169,137 |
| 50% |
49.9% |
141,232 |
140,914 |
| 40% |
39.5% |
112,986 |
111,480 |
| 30% |
29.7% |
84,739 |
83,847 |
| 20% |
20.0% |
56,493 |
56,385 |
| 10% |
10.0% |
28,246 |
28,170 |
| Active Idle |
|
0 |
0 |
JVM 'localhost.029' Scores:
| Target Load |
Actual Load |
ssj_ops |
| Target |
Actual |
| Calibration 1 |
|
|
225,904 |
| Calibration 2 |
|
|
283,392 |
| Calibration 3 |
|
|
283,889 |
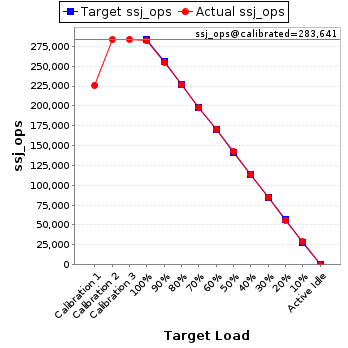
| ssj_ops@calibrated=283,641 |
| 100% |
99.3% |
283,641 |
281,795 |
| 90% |
89.9% |
255,277 |
254,983 |
| 80% |
79.9% |
226,913 |
226,529 |
| 70% |
69.6% |
198,549 |
197,527 |
| 60% |
60.2% |
170,185 |
170,727 |
| 50% |
50.2% |
141,820 |
142,522 |
| 40% |
40.0% |
113,456 |
113,560 |
| 30% |
30.0% |
85,092 |
85,039 |
| 20% |
19.8% |
56,728 |
56,051 |
| 10% |
10.1% |
28,364 |
28,759 |
| Active Idle |
|
0 |
0 |
JVM 'localhost.030' Scores:
| Target Load |
Actual Load |
ssj_ops |
| Target |
Actual |
| Calibration 1 |
|
|
221,834 |
| Calibration 2 |
|
|
278,686 |
| Calibration 3 |
|
|
278,860 |
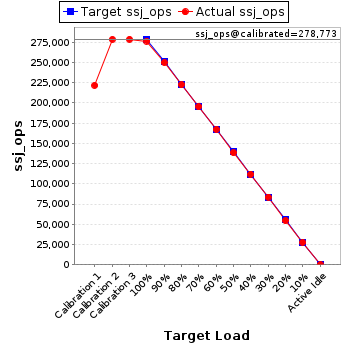
| ssj_ops@calibrated=278,773 |
| 100% |
99.2% |
278,773 |
276,611 |
| 90% |
89.7% |
250,896 |
249,960 |
| 80% |
79.8% |
223,018 |
222,458 |
| 70% |
70.1% |
195,141 |
195,335 |
| 60% |
60.1% |
167,264 |
167,480 |
| 50% |
49.6% |
139,386 |
138,403 |
| 40% |
40.2% |
111,509 |
111,936 |
| 30% |
30.0% |
83,632 |
83,699 |
| 20% |
19.5% |
55,755 |
54,354 |
| 10% |
10.0% |
27,877 |
27,787 |
| Active Idle |
|
0 |
0 |
JVM 'localhost.031' Scores:
| Target Load |
Actual Load |
ssj_ops |
| Target |
Actual |
| Calibration 1 |
|
|
225,082 |
| Calibration 2 |
|
|
283,914 |
| Calibration 3 |
|
|
284,315 |
| ssj_ops@calibrated=284,115 |
| 100% |
99.6% |
284,115 |
283,098 |
| 90% |
90.0% |
255,703 |
255,841 |
| 80% |
80.0% |
227,292 |
227,365 |
| 70% |
69.4% |
198,880 |
197,172 |
| 60% |
59.8% |
170,469 |
169,890 |
| 50% |
50.0% |
142,057 |
142,003 |
| 40% |
40.6% |
113,646 |
115,302 |
| 30% |
30.2% |
85,234 |
85,702 |
| 20% |
20.0% |
56,823 |
56,751 |
| 10% |
10.0% |
28,411 |
28,357 |
| Active Idle |
|
0 |
0 |
JVM 'localhost.032' Scores:
| Target Load |
Actual Load |
ssj_ops |
| Target |
Actual |
| Calibration 1 |
|
|
223,176 |
| Calibration 2 |
|
|
281,906 |
| Calibration 3 |
|
|
281,731 |
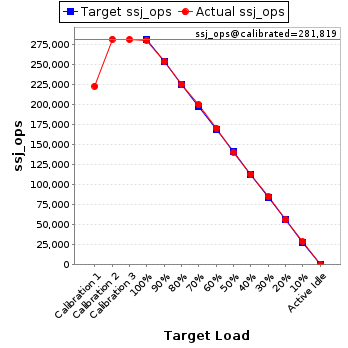
| ssj_ops@calibrated=281,819 |
| 100% |
99.6% |
281,819 |
280,767 |
| 90% |
90.1% |
253,637 |
254,009 |
| 80% |
80.1% |
225,455 |
225,740 |
| 70% |
71.0% |
197,273 |
200,178 |
| 60% |
60.6% |
169,091 |
170,808 |
| 50% |
50.0% |
140,909 |
140,881 |
| 40% |
40.0% |
112,727 |
112,739 |
| 30% |
30.1% |
84,546 |
84,962 |
| 20% |
20.0% |
56,364 |
56,371 |
| 10% |
10.2% |
28,182 |
28,656 |
| Active Idle |
|
0 |
0 |
JVM 'localhost.033' Scores:
| Target Load |
Actual Load |
ssj_ops |
| Target |
Actual |
| Calibration 1 |
|
|
221,159 |
| Calibration 2 |
|
|
280,190 |
| Calibration 3 |
|
|
279,722 |
| ssj_ops@calibrated=279,956 |
| 100% |
99.3% |
279,956 |
278,073 |
| 90% |
90.1% |
251,960 |
252,266 |
| 80% |
80.3% |
223,965 |
224,719 |
| 70% |
69.8% |
195,969 |
195,399 |
| 60% |
60.0% |
167,974 |
167,924 |
| 50% |
50.0% |
139,978 |
140,048 |
| 40% |
39.9% |
111,982 |
111,587 |
| 30% |
30.2% |
83,987 |
84,626 |
| 20% |
19.9% |
55,991 |
55,648 |
| 10% |
10.0% |
27,996 |
27,999 |
| Active Idle |
|
0 |
0 |
JVM 'localhost.034' Scores:
| Target Load |
Actual Load |
ssj_ops |
| Target |
Actual |
| Calibration 1 |
|
|
223,698 |
| Calibration 2 |
|
|
282,212 |
| Calibration 3 |
|
|
282,204 |
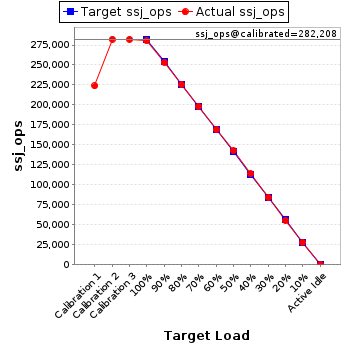
| ssj_ops@calibrated=282,208 |
| 100% |
99.4% |
282,208 |
280,376 |
| 90% |
89.8% |
253,987 |
253,352 |
| 80% |
79.8% |
225,766 |
225,257 |
| 70% |
70.2% |
197,545 |
198,039 |
| 60% |
59.9% |
169,325 |
169,065 |
| 50% |
50.5% |
141,104 |
142,515 |
| 40% |
40.3% |
112,883 |
113,704 |
| 30% |
29.9% |
84,662 |
84,303 |
| 20% |
19.6% |
56,442 |
55,337 |
| 10% |
9.9% |
28,221 |
27,981 |
| Active Idle |
|
0 |
0 |
JVM 'localhost.035' Scores:
| Target Load |
Actual Load |
ssj_ops |
| Target |
Actual |
| Calibration 1 |
|
|
221,258 |
| Calibration 2 |
|
|
280,159 |
| Calibration 3 |
|
|
279,856 |
| ssj_ops@calibrated=280,007 |
| 100% |
99.6% |
280,007 |
278,785 |
| 90% |
90.1% |
252,007 |
252,294 |
| 80% |
80.1% |
224,006 |
224,225 |
| 70% |
70.0% |
196,005 |
196,006 |
| 60% |
60.2% |
168,004 |
168,493 |
| 50% |
50.0% |
140,004 |
139,922 |
| 40% |
39.9% |
112,003 |
111,625 |
| 30% |
30.4% |
84,002 |
84,991 |
| 20% |
19.8% |
56,001 |
55,330 |
| 10% |
10.0% |
28,001 |
28,099 |
| Active Idle |
|
0 |
0 |
JVM 'localhost.036' Scores:
| Target Load |
Actual Load |
ssj_ops |
| Target |
Actual |
| Calibration 1 |
|
|
220,865 |
| Calibration 2 |
|
|
278,500 |
| Calibration 3 |
|
|
277,163 |
| ssj_ops@calibrated=277,832 |
| 100% |
99.8% |
277,832 |
277,390 |
| 90% |
90.2% |
250,049 |
250,734 |
| 80% |
80.1% |
222,265 |
222,408 |
| 70% |
70.1% |
194,482 |
194,663 |
| 60% |
59.9% |
166,699 |
166,499 |
| 50% |
50.0% |
138,916 |
138,782 |
| 40% |
40.4% |
111,133 |
112,146 |
| 30% |
30.1% |
83,350 |
83,741 |
| 20% |
20.0% |
55,566 |
55,523 |
| 10% |
10.1% |
27,783 |
28,004 |
| Active Idle |
|
0 |
0 |
JVM 'localhost.037' Scores:
| Target Load |
Actual Load |
ssj_ops |
| Target |
Actual |
| Calibration 1 |
|
|
221,605 |
| Calibration 2 |
|
|
279,427 |
| Calibration 3 |
|
|
279,556 |
| ssj_ops@calibrated=279,491 |
| 100% |
99.6% |
279,491 |
278,445 |
| 90% |
90.1% |
251,542 |
251,873 |
| 80% |
80.3% |
223,593 |
224,509 |
| 70% |
70.2% |
195,644 |
196,131 |
| 60% |
60.6% |
167,695 |
169,378 |
| 50% |
49.7% |
139,746 |
138,843 |
| 40% |
39.9% |
111,797 |
111,573 |
| 30% |
30.1% |
83,847 |
84,135 |
| 20% |
19.9% |
55,898 |
55,513 |
| 10% |
10.1% |
27,949 |
28,319 |
| Active Idle |
|
0 |
0 |
JVM 'localhost.038' Scores:
| Target Load |
Actual Load |
ssj_ops |
| Target |
Actual |
| Calibration 1 |
|
|
220,421 |
| Calibration 2 |
|
|
278,604 |
| Calibration 3 |
|
|
279,046 |
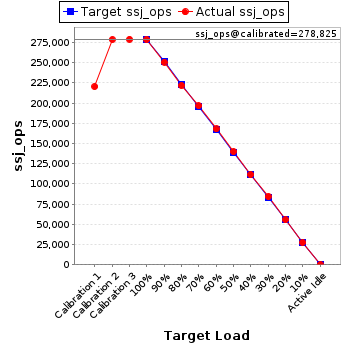
| ssj_ops@calibrated=278,825 |
| 100% |
100.0% |
278,825 |
278,704 |
| 90% |
90.0% |
250,943 |
250,807 |
| 80% |
79.5% |
223,060 |
221,688 |
| 70% |
70.5% |
195,178 |
196,612 |
| 60% |
60.2% |
167,295 |
167,956 |
| 50% |
50.2% |
139,413 |
139,868 |
| 40% |
39.9% |
111,530 |
111,314 |
| 30% |
30.3% |
83,648 |
84,350 |
| 20% |
19.9% |
55,765 |
55,390 |
| 10% |
9.9% |
27,883 |
27,592 |
| Active Idle |
|
0 |
0 |
JVM 'localhost.039' Scores:
| Target Load |
Actual Load |
ssj_ops |
| Target |
Actual |
| Calibration 1 |
|
|
222,860 |
| Calibration 2 |
|
|
283,402 |
| Calibration 3 |
|
|
283,133 |
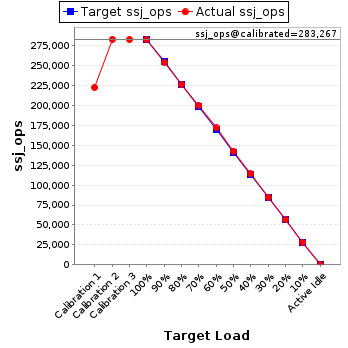
| ssj_ops@calibrated=283,267 |
| 100% |
99.9% |
283,267 |
282,936 |
| 90% |
89.8% |
254,940 |
254,331 |
| 80% |
80.0% |
226,614 |
226,663 |
| 70% |
70.6% |
198,287 |
200,016 |
| 60% |
60.7% |
169,960 |
171,898 |
| 50% |
50.4% |
141,634 |
142,887 |
| 40% |
40.2% |
113,307 |
114,001 |
| 30% |
30.0% |
84,980 |
85,016 |
| 20% |
20.0% |
56,653 |
56,546 |
| 10% |
9.9% |
28,327 |
27,998 |
| Active Idle |
|
0 |
0 |
JVM 'localhost.040' Scores:
| Target Load |
Actual Load |
ssj_ops |
| Target |
Actual |
| Calibration 1 |
|
|
223,199 |
| Calibration 2 |
|
|
282,577 |
| Calibration 3 |
|
|
282,271 |
| ssj_ops@calibrated=282,424 |
| 100% |
99.3% |
282,424 |
280,571 |
| 90% |
89.9% |
254,181 |
253,903 |
| 80% |
79.7% |
225,939 |
225,112 |
| 70% |
70.4% |
197,697 |
198,705 |
| 60% |
59.9% |
169,454 |
169,230 |
| 50% |
50.0% |
141,212 |
141,229 |
| 40% |
40.2% |
112,969 |
113,656 |
| 30% |
29.9% |
84,727 |
84,569 |
| 20% |
20.1% |
56,485 |
56,890 |
| 10% |
10.2% |
28,242 |
28,740 |
| Active Idle |
|
0 |
0 |
JVM 'localhost.041' Scores:
| Target Load |
Actual Load |
ssj_ops |
| Target |
Actual |
| Calibration 1 |
|
|
223,409 |
| Calibration 2 |
|
|
280,979 |
| Calibration 3 |
|
|
281,461 |
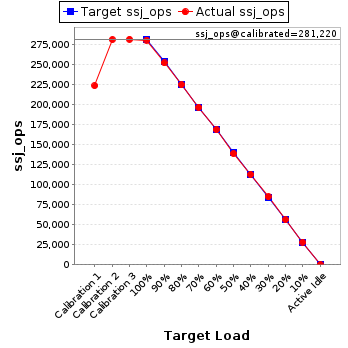
| ssj_ops@calibrated=281,220 |
| 100% |
99.7% |
281,220 |
280,403 |
| 90% |
89.6% |
253,098 |
251,887 |
| 80% |
79.8% |
224,976 |
224,538 |
| 70% |
69.9% |
196,854 |
196,470 |
| 60% |
60.0% |
168,732 |
168,638 |
| 50% |
49.3% |
140,610 |
138,591 |
| 40% |
40.0% |
112,488 |
112,573 |
| 30% |
30.1% |
84,366 |
84,698 |
| 20% |
19.9% |
56,244 |
55,986 |
| 10% |
10.0% |
28,122 |
28,223 |
| Active Idle |
|
0 |
0 |
JVM 'localhost.042' Scores:
| Target Load |
Actual Load |
ssj_ops |
| Target |
Actual |
| Calibration 1 |
|
|
226,732 |
| Calibration 2 |
|
|
285,057 |
| Calibration 3 |
|
|
284,639 |
| ssj_ops@calibrated=284,848 |
| 100% |
99.6% |
284,848 |
283,680 |
| 90% |
89.8% |
256,363 |
255,873 |
| 80% |
80.3% |
227,878 |
228,864 |
| 70% |
70.3% |
199,393 |
200,176 |
| 60% |
59.5% |
170,909 |
169,528 |
| 50% |
49.8% |
142,424 |
141,960 |
| 40% |
39.9% |
113,939 |
113,599 |
| 30% |
29.8% |
85,454 |
84,802 |
| 20% |
20.0% |
56,970 |
57,028 |
| 10% |
10.2% |
28,485 |
29,108 |
| Active Idle |
|
0 |
0 |
JVM 'localhost.043' Scores:
| Target Load |
Actual Load |
ssj_ops |
| Target |
Actual |
| Calibration 1 |
|
|
227,627 |
| Calibration 2 |
|
|
285,316 |
| Calibration 3 |
|
|
285,392 |
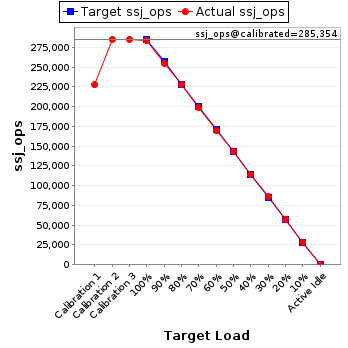
| ssj_ops@calibrated=285,354 |
| 100% |
99.6% |
285,354 |
284,276 |
| 90% |
89.2% |
256,819 |
254,617 |
| 80% |
80.0% |
228,284 |
228,286 |
| 70% |
69.7% |
199,748 |
198,954 |
| 60% |
59.4% |
171,213 |
169,381 |
| 50% |
50.1% |
142,677 |
143,066 |
| 40% |
40.0% |
114,142 |
114,029 |
| 30% |
30.1% |
85,606 |
86,019 |
| 20% |
20.1% |
57,071 |
57,362 |
| 10% |
10.0% |
28,535 |
28,482 |
| Active Idle |
|
0 |
0 |
JVM 'localhost.044' Scores:
| Target Load |
Actual Load |
ssj_ops |
| Target |
Actual |
| Calibration 1 |
|
|
214,528 |
| Calibration 2 |
|
|
265,740 |
| Calibration 3 |
|
|
265,729 |
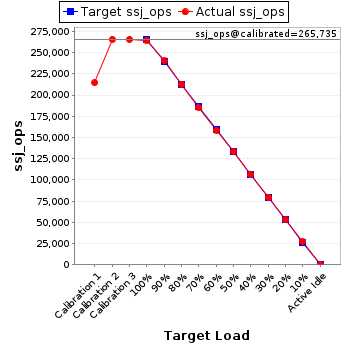
| ssj_ops@calibrated=265,735 |
| 100% |
99.6% |
265,735 |
264,633 |
| 90% |
90.4% |
239,161 |
240,157 |
| 80% |
80.1% |
212,588 |
212,746 |
| 70% |
69.8% |
186,014 |
185,367 |
| 60% |
59.6% |
159,441 |
158,452 |
| 50% |
50.1% |
132,867 |
133,082 |
| 40% |
40.1% |
106,294 |
106,464 |
| 30% |
29.9% |
79,720 |
79,413 |
| 20% |
19.9% |
53,147 |
52,748 |
| 10% |
10.2% |
26,573 |
27,079 |
| Active Idle |
|
0 |
0 |
JVM 'localhost.045' Scores:
| Target Load |
Actual Load |
ssj_ops |
| Target |
Actual |
| Calibration 1 |
|
|
229,096 |
| Calibration 2 |
|
|
286,538 |
| Calibration 3 |
|
|
286,346 |
| ssj_ops@calibrated=286,442 |
| 100% |
99.2% |
286,442 |
284,192 |
| 90% |
90.1% |
257,798 |
258,185 |
| 80% |
80.0% |
229,154 |
229,021 |
| 70% |
69.9% |
200,509 |
200,196 |
| 60% |
60.6% |
171,865 |
173,650 |
| 50% |
49.7% |
143,221 |
142,411 |
| 40% |
40.4% |
114,577 |
115,758 |
| 30% |
30.2% |
85,933 |
86,586 |
| 20% |
19.9% |
57,288 |
56,877 |
| 10% |
9.8% |
28,644 |
28,179 |
| Active Idle |
|
0 |
0 |
JVM 'localhost.046' Scores:
| Target Load |
Actual Load |
ssj_ops |
| Target |
Actual |
| Calibration 1 |
|
|
223,479 |
| Calibration 2 |
|
|
280,487 |
| Calibration 3 |
|
|
280,247 |
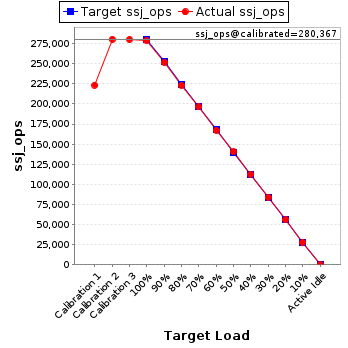
| ssj_ops@calibrated=280,367 |
| 100% |
99.4% |
280,367 |
278,690 |
| 90% |
89.8% |
252,330 |
251,719 |
| 80% |
79.6% |
224,294 |
223,184 |
| 70% |
70.0% |
196,257 |
196,235 |
| 60% |
59.6% |
168,220 |
167,095 |
| 50% |
50.1% |
140,183 |
140,476 |
| 40% |
40.2% |
112,147 |
112,651 |
| 30% |
29.9% |
84,110 |
83,872 |
| 20% |
19.9% |
56,073 |
55,768 |
| 10% |
9.9% |
28,037 |
27,805 |
| Active Idle |
|
0 |
0 |
JVM 'localhost.047' Scores:
| Target Load |
Actual Load |
ssj_ops |
| Target |
Actual |
| Calibration 1 |
|
|
224,556 |
| Calibration 2 |
|
|
283,167 |
| Calibration 3 |
|
|
283,212 |
| ssj_ops@calibrated=283,190 |
| 100% |
99.9% |
283,190 |
282,966 |
| 90% |
90.3% |
254,871 |
255,808 |
| 80% |
79.7% |
226,552 |
225,755 |
| 70% |
69.8% |
198,233 |
197,774 |
| 60% |
59.5% |
169,914 |
168,619 |
| 50% |
49.2% |
141,595 |
139,389 |
| 40% |
40.0% |
113,276 |
113,192 |
| 30% |
30.0% |
84,957 |
85,053 |
| 20% |
20.0% |
56,638 |
56,774 |
| 10% |
10.0% |
28,319 |
28,267 |
| Active Idle |
|
0 |
0 |
JVM 'localhost.048' Scores:
| Target Load |
Actual Load |
ssj_ops |
| Target |
Actual |
| Calibration 1 |
|
|
221,069 |
| Calibration 2 |
|
|
278,967 |
| Calibration 3 |
|
|
278,719 |
| ssj_ops@calibrated=278,843 |
| 100% |
99.5% |
278,843 |
277,444 |
| 90% |
89.9% |
250,959 |
250,551 |
| 80% |
79.9% |
223,074 |
222,909 |
| 70% |
70.3% |
195,190 |
196,060 |
| 60% |
59.5% |
167,306 |
165,812 |
| 50% |
49.9% |
139,421 |
139,256 |
| 40% |
40.2% |
111,537 |
112,003 |
| 30% |
30.0% |
83,653 |
83,551 |
| 20% |
20.1% |
55,769 |
56,008 |
| 10% |
9.8% |
27,884 |
27,236 |
| Active Idle |
|
0 |
0 |
JVM 'localhost.049' Scores:
| Target Load |
Actual Load |
ssj_ops |
| Target |
Actual |
| Calibration 1 |
|
|
225,209 |
| Calibration 2 |
|
|
283,620 |
| Calibration 3 |
|
|
282,361 |
| ssj_ops@calibrated=282,991 |
| 100% |
99.9% |
282,991 |
282,695 |
| 90% |
90.4% |
254,692 |
255,761 |
| 80% |
80.0% |
226,393 |
226,464 |
| 70% |
70.4% |
198,093 |
199,197 |
| 60% |
59.8% |
169,794 |
169,090 |
| 50% |
49.9% |
141,495 |
141,075 |
| 40% |
40.0% |
113,196 |
113,151 |
| 30% |
29.7% |
84,897 |
84,133 |
| 20% |
19.9% |
56,598 |
56,183 |
| 10% |
10.1% |
28,299 |
28,645 |
| Active Idle |
|
0 |
0 |
JVM 'localhost.050' Scores:
| Target Load |
Actual Load |
ssj_ops |
| Target |
Actual |
| Calibration 1 |
|
|
211,879 |
| Calibration 2 |
|
|
266,670 |
| Calibration 3 |
|
|
267,156 |
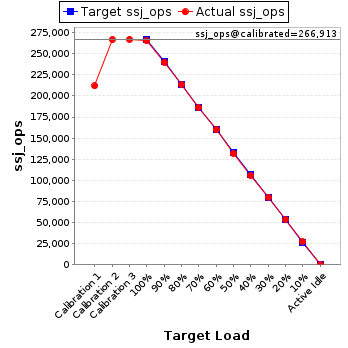
| ssj_ops@calibrated=266,913 |
| 100% |
99.3% |
266,913 |
265,171 |
| 90% |
89.8% |
240,221 |
239,780 |
| 80% |
79.9% |
213,530 |
213,192 |
| 70% |
69.8% |
186,839 |
186,252 |
| 60% |
60.0% |
160,148 |
160,034 |
| 50% |
49.4% |
133,456 |
131,894 |
| 40% |
39.6% |
106,765 |
105,767 |
| 30% |
29.9% |
80,074 |
79,899 |
| 20% |
19.9% |
53,383 |
53,212 |
| 10% |
10.1% |
26,691 |
27,056 |
| Active Idle |
|
0 |
0 |
JVM 'localhost.051' Scores:
| Target Load |
Actual Load |
ssj_ops |
| Target |
Actual |
| Calibration 1 |
|
|
221,112 |
| Calibration 2 |
|
|
278,441 |
| Calibration 3 |
|
|
277,184 |
| ssj_ops@calibrated=277,812 |
| 100% |
99.5% |
277,812 |
276,550 |
| 90% |
89.9% |
250,031 |
249,780 |
| 80% |
79.9% |
222,250 |
221,964 |
| 70% |
69.9% |
194,469 |
194,226 |
| 60% |
59.9% |
166,687 |
166,368 |
| 50% |
50.1% |
138,906 |
139,161 |
| 40% |
40.0% |
111,125 |
111,248 |
| 30% |
30.5% |
83,344 |
84,618 |
| 20% |
19.8% |
55,562 |
54,925 |
| 10% |
10.1% |
27,781 |
28,012 |
| Active Idle |
|
0 |
0 |
JVM 'localhost.052' Scores:
| Target Load |
Actual Load |
ssj_ops |
| Target |
Actual |
| Calibration 1 |
|
|
223,495 |
| Calibration 2 |
|
|
281,544 |
| Calibration 3 |
|
|
281,581 |
| ssj_ops@calibrated=281,562 |
| 100% |
99.9% |
281,562 |
281,228 |
| 90% |
90.0% |
253,406 |
253,514 |
| 80% |
80.1% |
225,250 |
225,569 |
| 70% |
70.0% |
197,094 |
197,098 |
| 60% |
60.6% |
168,937 |
170,686 |
| 50% |
49.6% |
140,781 |
139,680 |
| 40% |
39.7% |
112,625 |
111,832 |
| 30% |
30.4% |
84,469 |
85,486 |
| 20% |
20.1% |
56,312 |
56,532 |
| 10% |
9.8% |
28,156 |
27,647 |
| Active Idle |
|
0 |
0 |
JVM 'localhost.053' Scores:
| Target Load |
Actual Load |
ssj_ops |
| Target |
Actual |
| Calibration 1 |
|
|
226,196 |
| Calibration 2 |
|
|
283,542 |
| Calibration 3 |
|
|
283,419 |
| ssj_ops@calibrated=283,480 |
| 100% |
99.8% |
283,480 |
282,806 |
| 90% |
89.7% |
255,132 |
254,369 |
| 80% |
80.1% |
226,784 |
227,021 |
| 70% |
70.6% |
198,436 |
200,144 |
| 60% |
59.8% |
170,088 |
169,579 |
| 50% |
50.4% |
141,740 |
142,826 |
| 40% |
40.2% |
113,392 |
113,847 |
| 30% |
30.2% |
85,044 |
85,609 |
| 20% |
19.8% |
56,696 |
56,107 |
| 10% |
10.0% |
28,348 |
28,390 |
| Active Idle |
|
0 |
0 |
JVM 'localhost.054' Scores:
| Target Load |
Actual Load |
ssj_ops |
| Target |
Actual |
| Calibration 1 |
|
|
226,697 |
| Calibration 2 |
|
|
285,363 |
| Calibration 3 |
|
|
283,735 |
| ssj_ops@calibrated=284,549 |
| 100% |
99.8% |
284,549 |
284,046 |
| 90% |
90.3% |
256,094 |
256,856 |
| 80% |
80.5% |
227,639 |
229,107 |
| 70% |
69.8% |
199,184 |
198,540 |
| 60% |
59.8% |
170,729 |
170,078 |
| 50% |
50.4% |
142,274 |
143,460 |
| 40% |
40.3% |
113,820 |
114,572 |
| 30% |
30.0% |
85,365 |
85,407 |
| 20% |
20.3% |
56,910 |
57,645 |
| 10% |
9.9% |
28,455 |
28,229 |
| Active Idle |
|
0 |
0 |
JVM 'localhost.055' Scores:
| Target Load |
Actual Load |
ssj_ops |
| Target |
Actual |
| Calibration 1 |
|
|
210,364 |
| Calibration 2 |
|
|
263,900 |
| Calibration 3 |
|
|
262,597 |
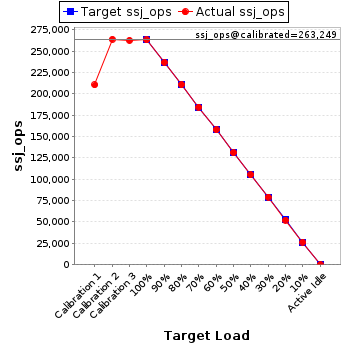
| ssj_ops@calibrated=263,249 |
| 100% |
99.9% |
263,249 |
263,097 |
| 90% |
90.0% |
236,924 |
236,940 |
| 80% |
80.0% |
210,599 |
210,613 |
| 70% |
70.1% |
184,274 |
184,521 |
| 60% |
60.0% |
157,949 |
157,900 |
| 50% |
49.8% |
131,624 |
131,113 |
| 40% |
39.9% |
105,299 |
105,074 |
| 30% |
30.1% |
78,975 |
79,215 |
| 20% |
19.8% |
52,650 |
52,249 |
| 10% |
10.1% |
26,325 |
26,472 |
| Active Idle |
|
0 |
0 |
JVM 'localhost.056' Scores:
| Target Load |
Actual Load |
ssj_ops |
| Target |
Actual |
| Calibration 1 |
|
|
224,829 |
| Calibration 2 |
|
|
280,249 |
| Calibration 3 |
|
|
280,405 |
| ssj_ops@calibrated=280,327 |
| 100% |
99.7% |
280,327 |
279,536 |
| 90% |
90.3% |
252,294 |
253,200 |
| 80% |
80.1% |
224,262 |
224,539 |
| 70% |
70.0% |
196,229 |
196,169 |
| 60% |
59.7% |
168,196 |
167,282 |
| 50% |
49.8% |
140,164 |
139,609 |
| 40% |
39.8% |
112,131 |
111,467 |
| 30% |
30.0% |
84,098 |
83,975 |
| 20% |
20.0% |
56,065 |
55,986 |
| 10% |
9.9% |
28,033 |
27,718 |
| Active Idle |
|
0 |
0 |
JVM 'localhost.057' Scores:
| Target Load |
Actual Load |
ssj_ops |
| Target |
Actual |
| Calibration 1 |
|
|
218,633 |
| Calibration 2 |
|
|
274,464 |
| Calibration 3 |
|
|
274,514 |
| ssj_ops@calibrated=274,489 |
| 100% |
99.7% |
274,489 |
273,707 |
| 90% |
89.6% |
247,040 |
245,850 |
| 80% |
79.7% |
219,591 |
218,740 |
| 70% |
69.8% |
192,142 |
191,650 |
| 60% |
59.8% |
164,693 |
164,046 |
| 50% |
50.3% |
137,244 |
138,078 |
| 40% |
40.3% |
109,795 |
110,493 |
| 30% |
30.2% |
82,347 |
82,931 |
| 20% |
20.2% |
54,898 |
55,322 |
| 10% |
10.0% |
27,449 |
27,394 |
| Active Idle |
|
0 |
0 |
JVM 'localhost.058' Scores:
| Target Load |
Actual Load |
ssj_ops |
| Target |
Actual |
| Calibration 1 |
|
|
228,820 |
| Calibration 2 |
|
|
285,841 |
| Calibration 3 |
|
|
285,715 |
| ssj_ops@calibrated=285,778 |
| 100% |
99.4% |
285,778 |
283,966 |
| 90% |
90.2% |
257,200 |
257,831 |
| 80% |
80.6% |
228,622 |
230,353 |
| 70% |
70.0% |
200,045 |
200,071 |
| 60% |
60.1% |
171,467 |
171,673 |
| 50% |
49.8% |
142,889 |
142,239 |
| 40% |
40.2% |
114,311 |
114,778 |
| 30% |
30.1% |
85,733 |
85,926 |
| 20% |
19.9% |
57,156 |
56,732 |
| 10% |
10.1% |
28,578 |
28,851 |
| Active Idle |
|
0 |
0 |
JVM 'localhost.059' Scores:
| Target Load |
Actual Load |
ssj_ops |
| Target |
Actual |
| Calibration 1 |
|
|
226,892 |
| Calibration 2 |
|
|
282,171 |
| Calibration 3 |
|
|
282,135 |
| ssj_ops@calibrated=282,153 |
| 100% |
99.7% |
282,153 |
281,310 |
| 90% |
90.1% |
253,937 |
254,110 |
| 80% |
80.5% |
225,722 |
227,224 |
| 70% |
69.7% |
197,507 |
196,751 |
| 60% |
60.3% |
169,292 |
170,039 |
| 50% |
50.1% |
141,076 |
141,257 |
| 40% |
40.0% |
112,861 |
112,967 |
| 30% |
30.1% |
84,646 |
84,974 |
| 20% |
20.0% |
56,431 |
56,290 |
| 10% |
9.9% |
28,215 |
27,963 |
| Active Idle |
|
0 |
0 |
JVM 'localhost.060' Scores:
| Target Load |
Actual Load |
ssj_ops |
| Target |
Actual |
| Calibration 1 |
|
|
222,614 |
| Calibration 2 |
|
|
281,099 |
| Calibration 3 |
|
|
281,102 |
| ssj_ops@calibrated=281,100 |
| 100% |
99.6% |
281,100 |
280,029 |
| 90% |
90.0% |
252,990 |
253,103 |
| 80% |
80.0% |
224,880 |
225,012 |
| 70% |
70.1% |
196,770 |
197,137 |
| 60% |
60.0% |
168,660 |
168,757 |
| 50% |
50.1% |
140,550 |
140,813 |
| 40% |
39.5% |
112,440 |
111,167 |
| 30% |
30.1% |
84,330 |
84,625 |
| 20% |
20.0% |
56,220 |
56,143 |
| 10% |
10.2% |
28,110 |
28,671 |
| Active Idle |
|
0 |
0 |
JVM 'localhost.061' Scores:
| Target Load |
Actual Load |
ssj_ops |
| Target |
Actual |
| Calibration 1 |
|
|
222,049 |
| Calibration 2 |
|
|
283,195 |
| Calibration 3 |
|
|
284,187 |
| ssj_ops@calibrated=283,691 |
| 100% |
99.7% |
283,691 |
282,769 |
| 90% |
90.4% |
255,322 |
256,371 |
| 80% |
80.9% |
226,953 |
229,580 |
| 70% |
70.0% |
198,584 |
198,604 |
| 60% |
60.1% |
170,215 |
170,407 |
| 50% |
49.7% |
141,845 |
140,891 |
| 40% |
39.8% |
113,476 |
112,999 |
| 30% |
29.7% |
85,107 |
84,131 |
| 20% |
19.7% |
56,738 |
55,961 |
| 10% |
9.9% |
28,369 |
28,154 |
| Active Idle |
|
0 |
0 |
JVM 'localhost.062' Scores:
| Target Load |
Actual Load |
ssj_ops |
| Target |
Actual |
| Calibration 1 |
|
|
222,830 |
| Calibration 2 |
|
|
281,166 |
| Calibration 3 |
|
|
281,289 |
| ssj_ops@calibrated=281,228 |
| 100% |
99.8% |
281,228 |
280,640 |
| 90% |
89.4% |
253,105 |
251,546 |
| 80% |
80.0% |
224,982 |
225,031 |
| 70% |
70.5% |
196,859 |
198,293 |
| 60% |
60.2% |
168,737 |
169,198 |
| 50% |
50.1% |
140,614 |
140,779 |
| 40% |
39.7% |
112,491 |
111,784 |
| 30% |
30.3% |
84,368 |
85,320 |
| 20% |
19.9% |
56,246 |
55,920 |
| 10% |
10.0% |
28,123 |
28,146 |
| Active Idle |
|
0 |
0 |
JVM 'localhost.063' Scores:
| Target Load |
Actual Load |
ssj_ops |
| Target |
Actual |
| Calibration 1 |
|
|
225,873 |
| Calibration 2 |
|
|
280,143 |
| Calibration 3 |
|
|
280,099 |
| ssj_ops@calibrated=280,121 |
| 100% |
99.6% |
280,121 |
278,946 |
| 90% |
89.7% |
252,109 |
251,259 |
| 80% |
80.0% |
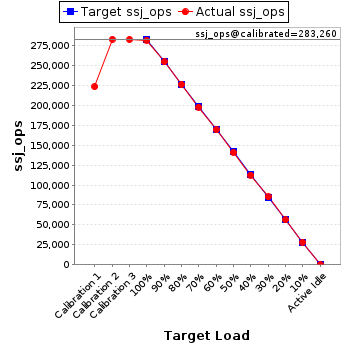
224,097 |
224,039 |
| 70% |
70.3% |
196,085 |
196,968 |
| 60% |
59.8% |
168,073 |
167,606 |
| 50% |
49.7% |
140,061 |
139,116 |
| 40% |
39.8% |
112,048 |
111,621 |
| 30% |
29.9% |
84,036 |
83,764 |
| 20% |
20.2% |
56,024 |
56,568 |
| 10% |
10.1% |
28,012 |
28,314 |
| Active Idle |
|
0 |
0 |
JVM 'localhost.064' Scores:
| Target Load |
Actual Load |
ssj_ops |
| Target |
Actual |
| Calibration 1 |
|
|
225,254 |
| Calibration 2 |
|
|
286,087 |
| Calibration 3 |
|
|
286,144 |
| ssj_ops@calibrated=286,115 |
| 100% |
99.6% |
286,115 |
284,884 |
| 90% |
90.4% |
257,504 |
258,559 |
| 80% |
80.1% |
228,892 |
229,256 |
| 70% |
70.2% |
200,281 |
200,810 |
| 60% |
60.6% |
171,669 |
173,446 |
| 50% |
50.4% |
143,058 |
144,191 |
| 40% |
39.9% |
114,446 |
114,109 |
| 30% |
30.5% |
85,835 |
87,283 |
| 20% |
19.8% |
57,223 |
56,703 |
| 10% |
9.7% |
28,612 |
27,684 |
| Active Idle |
|
0 |
0 |
JVM 'localhost.065' Scores:
| Target Load |
Actual Load |
ssj_ops |
| Target |
Actual |
| Calibration 1 |
|
|
223,751 |
| Calibration 2 |
|
|
283,349 |
| Calibration 3 |
|
|
283,172 |
| ssj_ops@calibrated=283,260 |
| 100% |
99.6% |
283,260 |
282,097 |
| 90% |
90.0% |
254,934 |
254,822 |
| 80% |
80.0% |
226,608 |
226,542 |
| 70% |
70.0% |
198,282 |
198,167 |
| 60% |
59.8% |
169,956 |
169,436 |
| 50% |
49.8% |
141,630 |
141,002 |
| 40% |
39.8% |
113,304 |
112,635 |
| 30% |
30.0% |
84,978 |
85,057 |
| 20% |
19.8% |
56,652 |
56,178 |
| 10% |
10.0% |
28,326 |
28,463 |
| Active Idle |
|
0 |
0 |
JVM 'localhost.066' Scores:
| Target Load |
Actual Load |
ssj_ops |
| Target |
Actual |
| Calibration 1 |
|
|
223,068 |
| Calibration 2 |
|
|
279,508 |
| Calibration 3 |
|
|
278,888 |
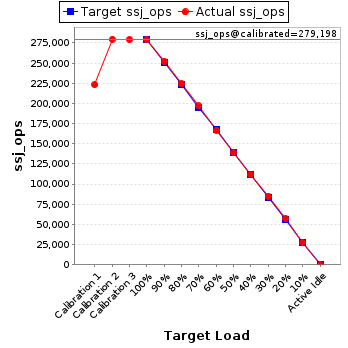
| ssj_ops@calibrated=279,198 |
| 100% |
99.8% |
279,198 |
278,609 |
| 90% |
90.2% |
251,278 |
251,729 |
| 80% |
80.3% |
223,358 |
224,095 |
| 70% |
70.5% |
195,438 |
196,738 |
| 60% |
59.8% |
167,519 |
166,875 |
| 50% |
49.7% |
139,599 |
138,626 |
| 40% |
40.0% |
111,679 |
111,605 |
| 30% |
30.4% |
83,759 |
84,950 |
| 20% |
20.4% |
55,840 |
56,872 |
| 10% |
9.8% |
27,920 |
27,225 |
| Active Idle |
|
0 |
0 |
JVM 'localhost.067' Scores:
| Target Load |
Actual Load |
ssj_ops |
| Target |
Actual |
| Calibration 1 |
|
|
221,869 |
| Calibration 2 |
|
|
283,192 |
| Calibration 3 |
|
|
282,684 |
| ssj_ops@calibrated=282,938 |
| 100% |
99.6% |
282,938 |
281,757 |
| 90% |
89.5% |
254,644 |
253,102 |
| 80% |
79.7% |
226,351 |
225,551 |
| 70% |
70.3% |
198,057 |
198,841 |
| 60% |
60.1% |
169,763 |
170,184 |
| 50% |
50.3% |
141,469 |
142,346 |
| 40% |
40.4% |
113,175 |
114,194 |
| 30% |
29.8% |
84,881 |
84,250 |
| 20% |
19.7% |
56,588 |
55,655 |
| 10% |
10.0% |
28,294 |
28,390 |
| Active Idle |
|
0 |
0 |
JVM 'localhost.068' Scores:
| Target Load |
Actual Load |
ssj_ops |
| Target |
Actual |
| Calibration 1 |
|
|
223,751 |
| Calibration 2 |
|
|
283,056 |
| Calibration 3 |
|
|
282,933 |
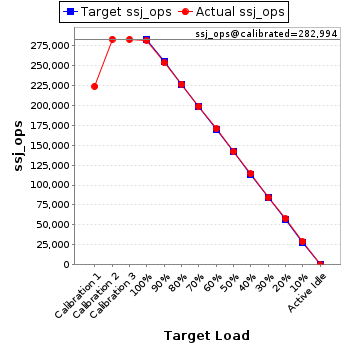
| ssj_ops@calibrated=282,994 |
| 100% |
99.5% |
282,994 |
281,695 |
| 90% |
89.5% |
254,695 |
253,355 |
| 80% |
80.1% |
226,395 |
226,793 |
| 70% |
70.2% |
198,096 |
198,787 |
| 60% |
60.3% |
169,797 |
170,784 |
| 50% |
50.1% |
141,497 |
141,792 |
| 40% |
40.3% |
113,198 |
114,129 |
| 30% |
29.8% |
84,898 |
84,345 |
| 20% |
20.4% |
56,599 |
57,678 |
| 10% |
10.2% |
28,299 |
28,850 |
| Active Idle |
|
0 |
0 |
JVM 'localhost.069' Scores:
| Target Load |
Actual Load |
ssj_ops |
| Target |
Actual |
| Calibration 1 |
|
|
221,924 |
| Calibration 2 |
|
|
277,747 |
| Calibration 3 |
|
|
277,717 |
| ssj_ops@calibrated=277,732 |
| 100% |
99.6% |
277,732 |
276,654 |
| 90% |
90.2% |
249,959 |
250,642 |
| 80% |
79.6% |
222,186 |
221,011 |
| 70% |
69.9% |
194,412 |
194,019 |
| 60% |
59.9% |
166,639 |
166,386 |
| 50% |
50.2% |
138,866 |
139,364 |
| 40% |
40.0% |
111,093 |
111,052 |
| 30% |
30.1% |
83,320 |
83,614 |
| 20% |
19.9% |
55,546 |
55,369 |
| 10% |
9.9% |
27,773 |
27,481 |
| Active Idle |
|
0 |
0 |
JVM 'localhost.070' Scores:
| Target Load |
Actual Load |
ssj_ops |
| Target |
Actual |
| Calibration 1 |
|
|
226,548 |
| Calibration 2 |
|
|
283,414 |
| Calibration 3 |
|
|
283,791 |
| ssj_ops@calibrated=283,603 |
| 100% |
99.4% |
283,603 |
281,861 |
| 90% |
89.9% |
255,242 |
254,837 |
| 80% |
80.2% |
226,882 |
227,423 |
| 70% |
69.7% |
198,522 |
197,553 |
| 60% |
59.9% |
170,162 |
169,972 |
| 50% |
50.1% |
141,801 |
141,983 |
| 40% |
40.1% |
113,441 |
113,856 |
| 30% |
30.1% |
85,081 |
85,498 |
| 20% |
20.1% |
56,721 |
56,887 |
| 10% |
10.1% |
28,360 |
28,646 |
| Active Idle |
|
0 |
0 |
JVM 'localhost.071' Scores:
| Target Load |
Actual Load |
ssj_ops |
| Target |
Actual |
| Calibration 1 |
|
|
225,921 |
| Calibration 2 |
|
|
280,656 |
| Calibration 3 |
|
|
280,643 |
| ssj_ops@calibrated=280,650 |
| 100% |
99.8% |
280,650 |
280,055 |
| 90% |
89.9% |
252,585 |
252,236 |
| 80% |
79.7% |
224,520 |
223,676 |
| 70% |
70.0% |
196,455 |
196,418 |
| 60% |
60.1% |
168,390 |
168,622 |
| 50% |
50.1% |
140,325 |
140,653 |
| 40% |
40.2% |
112,260 |
112,947 |
| 30% |
30.1% |
84,195 |
84,555 |
| 20% |
20.0% |
56,130 |
56,037 |
| 10% |
10.1% |
28,065 |
28,471 |
| Active Idle |
|
0 |
0 |
JVM 'localhost.072' Scores:
| Target Load |
Actual Load |
ssj_ops |
| Target |
Actual |
| Calibration 1 |
|
|
221,614 |
| Calibration 2 |
|
|
278,869 |
| Calibration 3 |
|
|
278,110 |
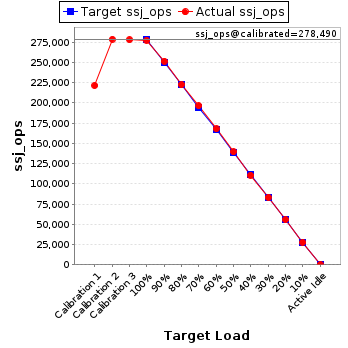
| ssj_ops@calibrated=278,490 |
| 100% |
99.6% |
278,490 |
277,478 |
| 90% |
90.4% |
250,641 |
251,719 |
| 80% |
79.9% |
222,792 |
222,454 |
| 70% |
70.6% |
194,943 |
196,514 |
| 60% |
60.3% |
167,094 |
168,040 |
| 50% |
50.1% |
139,245 |
139,481 |
| 40% |
39.7% |
111,396 |
110,460 |
| 30% |
29.9% |
83,547 |
83,159 |
| 20% |
19.9% |
55,698 |
55,550 |
| 10% |
10.0% |
27,849 |
27,841 |
| Active Idle |
|
0 |
0 |