
SPECpower_ssj2008
Aggregate Performance Report
Copyright © 2007-2022 Standard Performance Evaluation Corporation
| Hewlett Packard Enterprise Synergy 480 Gen10 Plus Compute Module | ssj_ops@100% = 58,639,526 ssj_ops@100% per Host = 8,377,075 ssj_ops@100% per JVM = 104,713 |
||||
| Test Sponsor: | Hewlett Packard Enterprise | SPEC License #: | 3 | Test Method: | Multi Node |
| Tested By: | Hewlett Packard Enterprise | Test Location: | Houston, TX, USA | Test Date: | Jan 13, 2022 |
| Hardware Availability: | Apr-2021 | Software Availability: | Apr-2021 | Publication: | Feb 16, 2022 |
| System Source: | Single Supplier | System Designation: | Server | Power Provisioning: | Line-powered |
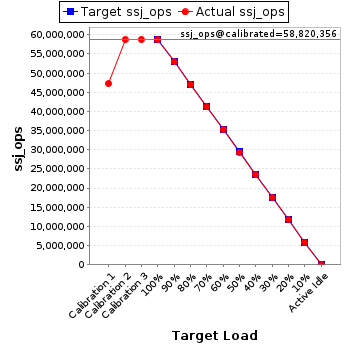
| Target Load | Actual Load | ssj_ops | |
|---|---|---|---|
| Target | Actual | ||
| Calibration 1 | 47,326,756 | ||
| Calibration 2 | 58,806,798 | ||
| Calibration 3 | 58,833,913 | ||
| ssj_ops@calibrated=58,820,356 | |||
| 100% | 99.7% | 58,820,356 | 58,639,526 |
| 90% | 90.0% | 52,938,320 | 52,943,902 |
| 80% | 80.0% | 47,056,284 | 47,058,604 |
| 70% | 70.0% | 41,174,249 | 41,190,129 |
| 60% | 60.0% | 35,292,213 | 35,263,186 |
| 50% | 49.9% | 29,410,178 | 29,378,454 |
| 40% | 40.0% | 23,528,142 | 23,521,674 |
| 30% | 30.0% | 17,646,107 | 17,646,248 |
| 20% | 20.0% | 11,764,071 | 11,763,807 |
| 10% | 10.0% | 5,882,036 | 5,877,705 |
| Active Idle | 0 | 0 | |
| # of Nodes | # of Chips | # of Cores | # of Threads | Total RAM (GB) | # of OS Images | # of JVM Instances |
|---|---|---|---|---|---|---|
| 7 | 14 | 560 | 1,120 | 1,792 | 7 | 560 |
| Set Identifier: | SUT |
| Set Description: | System Under Test |
| # of Identical Nodes: | 7 |
| Comment: | SUT |
| Hardware per Node | |
|---|---|
| Hardware Vendor: | Hewlett Packard Enterprise |
| Model: | Synergy 480 Gen10 Plus Compute Module |
| Form Factor: | Blade |
| CPU Name: | Intel Xeon Platinum 8380 CPU @ 2.30GHz |
| CPU Characteristics: | 40-Core, 2.30 GHz, 60MB L3 Cache |
| CPU Frequency (MHz): | 2300 |
| CPU(s) Enabled: | 80 cores, 2 chips, 40 cores/chip |
| Hardware Threads: | 160 (2 / core) |
| CPU(s) Orderable: | 1,2 chips |
| Primary Cache: | 32 KB I + 48 KB D on chip per core |
| Secondary Cache: | 1280 KB I+D on chip per core |
| Tertiary Cache: | 60 MB I+D on chip per chip |
| Other Cache: | None |
| Memory Amount (GB): | 256 |
| # and size of DIMM: | 16 x 16384 MB |
| Memory Details: | 16 x 16GB 2Rx8 PC4-3200-T; slots 1, 3, 5, 7, 10, 12, 14 & 16 on each socket |
| Power Supply Quantity and Rating (W): | None |
| Power Supply Details: | Shared |
| Disk Drive: | HPE 240GB SATA 6G Read Intensive SFF (P18420-B21) |
| Disk Controller: | Embedded SATA Controller |
| # and type of Network Interface Cards (NICs) Installed: | 1 x HPE Synergy 4820C 10/20/25Gb CNA |
| NICs Enabled in Firmware / OS / Connected: | 2/1/1 |
| Network Speed (Mbit): | 10000 |
| Keyboard: | None |
| Mouse: | None |
| Monitor: | None |
| Optical Drives: | No |
| Other Hardware: | None |
| Software per Node | |
|---|---|
| Power Management: | Enabled (see SUT Notes) |
| Operating System (OS): | SUSE Linux Enterprise Server 15 SP2 |
| OS Version: | 5.3.18-22-default |
| Filesystem: | xfs |
| JVM Vendor: | Oracle Corporation |
| JVM Version: | Oracle Java HotSpot(TM) 64-Bit Server VM 18.9 (build 11.0.11+9-LTS-194, mixed mode) |
| JVM Command-line Options: | -server -Xmn1700m -Xms1950m -Xmx1950m -XX:SurvivorRatio=1 -XX:TargetSurvivorRatio=99 -XX:ParallelGCThreads=2 -XX:AllocatePrefetchDistance=256 -XX:AllocatePrefetchLines=4 -XX:LoopUnrollLimit=45 -XX:InitialTenuringThreshold=12 -XX:MaxTenuringThreshold=15 -XX:InlineSmallCode=3900 -XX:MaxInlineSize=270 -XX:FreqInlineSize=2500 -XX:+UseLargePages -XX:+UseParallelOldGC -XX:UseAVX=0 -XX:-UseAdaptiveSizePolicy -XX:-ThreadLocalHandshakes |
| JVM Affinity: | for each physicalCore { numactl -C physicalCoreId, physicalCoreId + 80 } |
| JVM Instances: | 80 |
| JVM Initial Heap (MB): | 1950 |
| JVM Maximum Heap (MB): | 1950 |
| JVM Address Bits: | 64 |
| Boot Firmware Version: | I44 v1.40 (03/05/2021) |
| Management Firmware Version: | 2.40 pass 31 Jan 05 2021 |
| Workload Version: | SSJ 1.2.10 |
| Director Location: | Controller |
| Other Software: | None |
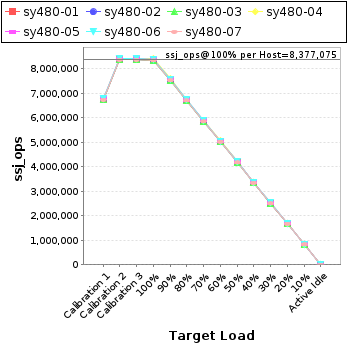
| Host | ssj_ops@100% |
|---|---|
| sy480-01 | 8,359,084 |
| sy480-02 | 8,352,665 |
| sy480-03 | 8,351,815 |
| sy480-04 | 8,411,724 |
| sy480-05 | 8,401,587 |
| sy480-06 | 8,403,759 |
| sy480-07 | 8,358,891 |
| ssj_ops@100% | 58,639,526 |
| ssj_ops@100% per Host | 8,377,075 |
| ssj_ops@100% per JVM | 104,713 |
| Target Load | Actual Load | ssj_ops | |
|---|---|---|---|
| Target | Actual | ||
| Calibration 1 | 6,755,124 | ||
| Calibration 2 | 8,390,866 | ||
| Calibration 3 | 8,394,302 | ||
| ssj_ops@calibrated=8,392,584 | |||
| 100% | 99.6% | 8,392,584 | 8,359,084 |
| 90% | 89.9% | 7,553,326 | 7,548,951 |
| 80% | 79.9% | 6,714,067 | 6,709,339 |
| 70% | 70.1% | 5,874,809 | 5,883,684 |
| 60% | 59.9% | 5,035,551 | 5,026,474 |
| 50% | 50.0% | 4,196,292 | 4,198,775 |
| 40% | 40.0% | 3,357,034 | 3,357,191 |
| 30% | 30.0% | 2,517,775 | 2,520,229 |
| 20% | 20.0% | 1,678,517 | 1,678,684 |
| 10% | 10.0% | 839,258 | 836,455 |
| Active Idle | 0 | 0 | |

| Target Load | Actual Load | ssj_ops | |
|---|---|---|---|
| Target | Actual | ||
| Calibration 1 | 6,740,924 | ||
| Calibration 2 | 8,381,613 | ||
| Calibration 3 | 8,381,830 | ||
| ssj_ops@calibrated=8,381,722 | |||
| 100% | 99.7% | 8,381,722 | 8,352,665 |
| 90% | 90.0% | 7,543,549 | 7,540,247 |
| 80% | 80.0% | 6,705,377 | 6,705,000 |
| 70% | 70.0% | 5,867,205 | 5,866,173 |
| 60% | 60.0% | 5,029,033 | 5,025,746 |
| 50% | 49.8% | 4,190,861 | 4,177,773 |
| 40% | 40.1% | 3,352,689 | 3,357,229 |
| 30% | 30.0% | 2,514,516 | 2,514,325 |
| 20% | 20.0% | 1,676,344 | 1,674,158 |
| 10% | 10.0% | 838,172 | 837,320 |
| Active Idle | 0 | 0 | |

| Target Load | Actual Load | ssj_ops | |
|---|---|---|---|
| Target | Actual | ||
| Calibration 1 | 6,735,246 | ||
| Calibration 2 | 8,378,059 | ||
| Calibration 3 | 8,382,051 | ||
| ssj_ops@calibrated=8,380,055 | |||
| 100% | 99.7% | 8,380,055 | 8,351,815 |
| 90% | 90.0% | 7,542,049 | 7,540,786 |
| 80% | 79.9% | 6,704,044 | 6,698,830 |
| 70% | 69.9% | 5,866,038 | 5,861,289 |
| 60% | 59.9% | 5,028,033 | 5,022,173 |
| 50% | 49.9% | 4,190,027 | 4,184,900 |
| 40% | 39.9% | 3,352,022 | 3,341,645 |
| 30% | 30.0% | 2,514,016 | 2,511,182 |
| 20% | 20.0% | 1,676,011 | 1,675,268 |
| 10% | 10.0% | 838,005 | 837,273 |
| Active Idle | 0 | 0 | |

| Target Load | Actual Load | ssj_ops | |
|---|---|---|---|
| Target | Actual | ||
| Calibration 1 | 6,775,126 | ||
| Calibration 2 | 8,431,427 | ||
| Calibration 3 | 8,436,085 | ||
| ssj_ops@calibrated=8,433,756 | |||
| 100% | 99.7% | 8,433,756 | 8,411,724 |
| 90% | 90.1% | 7,590,381 | 7,601,459 |
| 80% | 80.1% | 6,747,005 | 6,751,768 |
| 70% | 70.1% | 5,903,629 | 5,911,417 |
| 60% | 60.0% | 5,060,254 | 5,061,219 |
| 50% | 49.9% | 4,216,878 | 4,208,824 |
| 40% | 40.0% | 3,373,503 | 3,371,967 |
| 30% | 30.0% | 2,530,127 | 2,532,253 |
| 20% | 20.0% | 1,686,751 | 1,684,836 |
| 10% | 10.0% | 843,376 | 839,760 |
| Active Idle | 0 | 0 | |

| Target Load | Actual Load | ssj_ops | |
|---|---|---|---|
| Target | Actual | ||
| Calibration 1 | 6,801,077 | ||
| Calibration 2 | 8,423,826 | ||
| Calibration 3 | 8,429,045 | ||
| ssj_ops@calibrated=8,426,435 | |||
| 100% | 99.7% | 8,426,435 | 8,401,587 |
| 90% | 90.0% | 7,583,792 | 7,586,900 |
| 80% | 80.0% | 6,741,148 | 6,741,882 |
| 70% | 70.0% | 5,898,505 | 5,900,069 |
| 60% | 59.9% | 5,055,861 | 5,044,912 |
| 50% | 49.9% | 4,213,218 | 4,207,143 |
| 40% | 40.0% | 3,370,574 | 3,367,846 |
| 30% | 30.0% | 2,527,931 | 2,528,494 |
| 20% | 20.0% | 1,685,287 | 1,684,701 |
| 10% | 10.0% | 842,644 | 844,150 |
| Active Idle | 0 | 0 | |

| Target Load | Actual Load | ssj_ops | |
|---|---|---|---|
| Target | Actual | ||
| Calibration 1 | 6,776,913 | ||
| Calibration 2 | 8,421,099 | ||
| Calibration 3 | 8,426,212 | ||
| ssj_ops@calibrated=8,423,656 | |||
| 100% | 99.8% | 8,423,656 | 8,403,759 |
| 90% | 90.0% | 7,581,290 | 7,581,813 |
| 80% | 80.0% | 6,738,924 | 6,741,172 |
| 70% | 70.1% | 5,896,559 | 5,900,858 |
| 60% | 59.9% | 5,054,193 | 5,049,871 |
| 50% | 50.0% | 4,211,828 | 4,211,991 |
| 40% | 40.1% | 3,369,462 | 3,375,094 |
| 30% | 30.0% | 2,527,097 | 2,528,971 |
| 20% | 20.0% | 1,684,731 | 1,687,648 |
| 10% | 10.0% | 842,366 | 843,371 |
| Active Idle | 0 | 0 | |

| Target Load | Actual Load | ssj_ops | |
|---|---|---|---|
| Target | Actual | ||
| Calibration 1 | 6,742,346 | ||
| Calibration 2 | 8,379,908 | ||
| Calibration 3 | 8,384,388 | ||
| ssj_ops@calibrated=8,382,148 | |||
| 100% | 99.7% | 8,382,148 | 8,358,891 |
| 90% | 90.0% | 7,543,933 | 7,543,746 |
| 80% | 80.1% | 6,705,718 | 6,710,613 |
| 70% | 70.0% | 5,867,503 | 5,866,640 |
| 60% | 60.0% | 5,029,289 | 5,032,790 |
| 50% | 50.0% | 4,191,074 | 4,189,048 |
| 40% | 40.0% | 3,352,859 | 3,350,703 |
| 30% | 30.0% | 2,514,644 | 2,510,794 |
| 20% | 20.0% | 1,676,430 | 1,678,512 |
| 10% | 10.0% | 838,215 | 839,374 |
| Active Idle | 0 | 0 | |
