SPECpower_ssj2008
Aggregate Performance Report
Copyright © 2007-2022 Standard Performance Evaluation Corporation
| Hewlett Packard Enterprise Synergy 480 Gen10 Plus Compute Module | ssj_ops@100% = 41,895,333 ssj_ops@100% per Host = 8,379,067 ssj_ops@100% per JVM = 104,738 |
||||
| Test Sponsor: | Hewlett Packard Enterprise | SPEC License #: | 3 | Test Method: | Multi Node |
| Tested By: | Hewlett Packard Enterprise | Test Location: | Houston, TX, USA | Test Date: | Jan 14, 2022 |
| Hardware Availability: | Apr-2021 | Software Availability: | Apr-2021 | Publication: | Feb 16, 2022 |
| System Source: | Single Supplier | System Designation: | Server | Power Provisioning: | Line-powered |
| Target Load | Actual Load | ssj_ops | |
|---|---|---|---|
| Target | Actual | ||
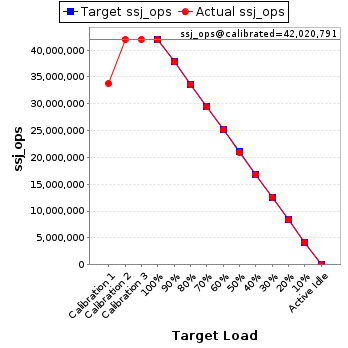
| Calibration 1 | 33,828,423 | ||
| Calibration 2 | 42,008,667 | ||
| Calibration 3 | 42,032,915 | ||
| ssj_ops@calibrated=42,020,791 | |||
| 100% | 99.7% | 42,020,791 | 41,895,333 |
| 90% | 90.0% | 37,818,712 | 37,813,127 |
| 80% | 80.0% | 33,616,633 | 33,616,554 |
| 70% | 70.1% | 29,414,554 | 29,440,788 |
| 60% | 59.9% | 25,212,475 | 25,186,750 |
| 50% | 49.9% | 21,010,396 | 20,984,520 |
| 40% | 39.9% | 16,808,316 | 16,785,725 |
| 30% | 30.0% | 12,606,237 | 12,610,987 |
| 20% | 20.0% | 8,404,158 | 8,403,092 |
| 10% | 10.0% | 4,202,079 | 4,201,071 |
| Active Idle | 0 | 0 | |
| # of Nodes | # of Chips | # of Cores | # of Threads | Total RAM (GB) | # of OS Images | # of JVM Instances |
|---|---|---|---|---|---|---|
| 5 | 10 | 400 | 800 | 1,280 | 5 | 400 |
| Set Identifier: | SUT |
| Set Description: | System Under Test |
| # of Identical Nodes: | 5 |
| Comment: | SUT |
| Hardware per Node | |
|---|---|
| Hardware Vendor: | Hewlett Packard Enterprise |
| Model: | Synergy 480 Gen10 Plus Compute Module |
| Form Factor: | Blade |
| CPU Name: | Intel Xeon Platinum 8380 CPU @ 2.30GHz |
| CPU Characteristics: | 40-Core, 2.30 GHz, 60MB L3 Cache |
| CPU Frequency (MHz): | 2300 |
| CPU(s) Enabled: | 80 cores, 2 chips, 40 cores/chip |
| Hardware Threads: | 160 (2 / core) |
| CPU(s) Orderable: | 1,2 chips |
| Primary Cache: | 32 KB I + 48 KB D on chip per core |
| Secondary Cache: | 1280 KB I+D on chip per core |
| Tertiary Cache: | 60 MB I+D on chip per chip |
| Other Cache: | None |
| Memory Amount (GB): | 256 |
| # and size of DIMM: | 16 x 16384 MB |
| Memory Details: | 16 x 16GB 2Rx8 PC4-3200-T; slots 1, 3, 5, 7, 10, 12, 14 & 16 on each socket |
| Power Supply Quantity and Rating (W): | None |
| Power Supply Details: | Shared |
| Disk Drive: | HPE 240GB SATA 6G Read Intensive SFF (P18420-B21) |
| Disk Controller: | Embedded SATA Controller |
| # and type of Network Interface Cards (NICs) Installed: | 1 x HPE Synergy 4820C 10/20/25Gb CNA |
| NICs Enabled in Firmware / OS / Connected: | 2/1/1 |
| Network Speed (Mbit): | 10000 |
| Keyboard: | None |
| Mouse: | None |
| Monitor: | None |
| Optical Drives: | No |
| Other Hardware: | None |
| Software per Node | |
|---|---|
| Power Management: | Enabled (see SUT Notes) |
| Operating System (OS): | SUSE Linux Enterprise Server 15 SP2 |
| OS Version: | 5.3.18-22-default |
| Filesystem: | xfs |
| JVM Vendor: | Oracle Corporation |
| JVM Version: | Oracle Java HotSpot(TM) 64-Bit Server VM 18.9 (build 11.0.11+9-LTS-194, mixed mode) |
| JVM Command-line Options: | -server -Xmn1700m -Xms1950m -Xmx1950m -XX:SurvivorRatio=1 -XX:TargetSurvivorRatio=99 -XX:ParallelGCThreads=2 -XX:AllocatePrefetchDistance=256 -XX:AllocatePrefetchLines=4 -XX:LoopUnrollLimit=45 -XX:InitialTenuringThreshold=12 -XX:MaxTenuringThreshold=15 -XX:InlineSmallCode=3900 -XX:MaxInlineSize=270 -XX:FreqInlineSize=2500 -XX:+UseLargePages -XX:+UseParallelOldGC -XX:UseAVX=0 -XX:-UseAdaptiveSizePolicy -XX:-ThreadLocalHandshakes |
| JVM Affinity: | for each physicalCore { numactl -C physicalCoreId, physicalCoreId + 80 } |
| JVM Instances: | 80 |
| JVM Initial Heap (MB): | 1950 |
| JVM Maximum Heap (MB): | 1950 |
| JVM Address Bits: | 64 |
| Boot Firmware Version: | I44 v1.40 (03/05/2021) |
| Management Firmware Version: | 2.40 pass 31 Jan 05 2021 |
| Workload Version: | SSJ 1.2.10 |
| Director Location: | Controller |
| Other Software: | None |
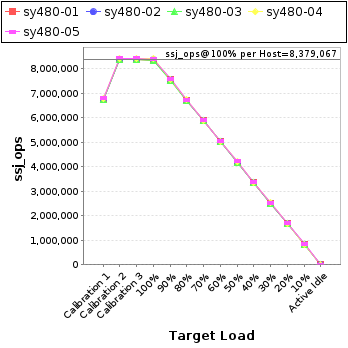
| Host | ssj_ops@100% |
|---|---|
| sy480-01 | 8,359,497 |
| sy480-02 | 8,368,877 |
| sy480-03 | 8,360,821 |
| sy480-04 | 8,404,089 |
| sy480-05 | 8,402,049 |
| ssj_ops@100% | 41,895,333 |
| ssj_ops@100% per Host | 8,379,067 |
| ssj_ops@100% per JVM | 104,738 |
| Target Load | Actual Load | ssj_ops | |
|---|---|---|---|
| Target | Actual | ||
| Calibration 1 | 6,764,379 | ||
| Calibration 2 | 8,384,445 | ||
| Calibration 3 | 8,389,041 | ||
| ssj_ops@calibrated=8,386,743 | |||
| 100% | 99.7% | 8,386,743 | 8,359,497 |
| 90% | 90.1% | 7,548,069 | 7,553,570 |
| 80% | 80.0% | 6,709,394 | 6,708,704 |
| 70% | 70.1% | 5,870,720 | 5,878,431 |
| 60% | 59.9% | 5,032,046 | 5,025,661 |
| 50% | 49.9% | 4,193,371 | 4,186,794 |
| 40% | 39.9% | 3,354,697 | 3,346,554 |
| 30% | 30.0% | 2,516,023 | 2,515,027 |
| 20% | 20.0% | 1,677,349 | 1,674,737 |
| 10% | 10.0% | 838,674 | 837,971 |
| Active Idle | 0 | 0 | |

| Target Load | Actual Load | ssj_ops | |
|---|---|---|---|
| Target | Actual | ||
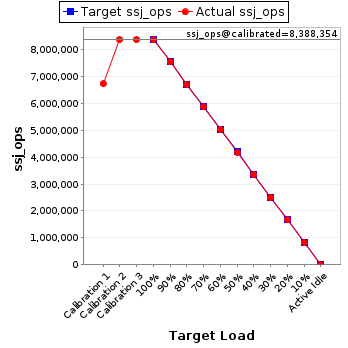
| Calibration 1 | 6,739,481 | ||
| Calibration 2 | 8,386,096 | ||
| Calibration 3 | 8,390,612 | ||
| ssj_ops@calibrated=8,388,354 | |||
| 100% | 99.8% | 8,388,354 | 8,368,877 |
| 90% | 90.0% | 7,549,518 | 7,546,607 |
| 80% | 80.0% | 6,710,683 | 6,712,628 |
| 70% | 70.1% | 5,871,848 | 5,877,230 |
| 60% | 60.0% | 5,033,012 | 5,030,140 |
| 50% | 49.9% | 4,194,177 | 4,189,670 |
| 40% | 40.0% | 3,355,342 | 3,353,837 |
| 30% | 30.0% | 2,516,506 | 2,516,857 |
| 20% | 20.0% | 1,677,671 | 1,677,598 |
| 10% | 10.0% | 838,835 | 837,675 |
| Active Idle | 0 | 0 | |
| Target Load | Actual Load | ssj_ops | |
|---|---|---|---|
| Target | Actual | ||
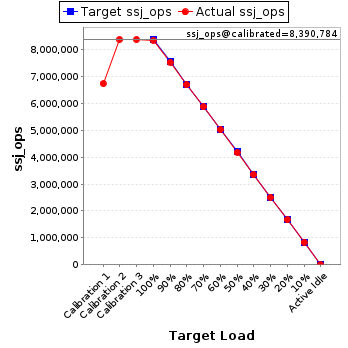
| Calibration 1 | 6,745,754 | ||
| Calibration 2 | 8,388,822 | ||
| Calibration 3 | 8,392,746 | ||
| ssj_ops@calibrated=8,390,784 | |||
| 100% | 99.6% | 8,390,784 | 8,360,821 |
| 90% | 89.9% | 7,551,706 | 7,544,123 |
| 80% | 79.9% | 6,712,627 | 6,705,196 |
| 70% | 70.1% | 5,873,549 | 5,880,021 |
| 60% | 60.0% | 5,034,470 | 5,030,680 |
| 50% | 49.9% | 4,195,392 | 4,184,604 |
| 40% | 40.0% | 3,356,314 | 3,353,027 |
| 30% | 30.0% | 2,517,235 | 2,515,765 |
| 20% | 20.0% | 1,678,157 | 1,677,205 |
| 10% | 10.0% | 839,078 | 838,837 |
| Active Idle | 0 | 0 | |
| Target Load | Actual Load | ssj_ops | |
|---|---|---|---|
| Target | Actual | ||
| Calibration 1 | 6,782,434 | ||
| Calibration 2 | 8,421,453 | ||
| Calibration 3 | 8,427,664 | ||
| ssj_ops@calibrated=8,424,558 | |||
| 100% | 99.8% | 8,424,558 | 8,404,089 |
| 90% | 90.0% | 7,582,102 | 7,582,952 |
| 80% | 80.1% | 6,739,647 | 6,748,294 |
| 70% | 70.1% | 5,897,191 | 5,901,453 |
| 60% | 59.9% | 5,054,735 | 5,048,430 |
| 50% | 49.9% | 4,212,279 | 4,204,783 |
| 40% | 40.0% | 3,369,823 | 3,368,206 |
| 30% | 30.0% | 2,527,367 | 2,528,023 |
| 20% | 20.0% | 1,684,912 | 1,688,226 |
| 10% | 10.0% | 842,456 | 840,677 |
| Active Idle | 0 | 0 | |
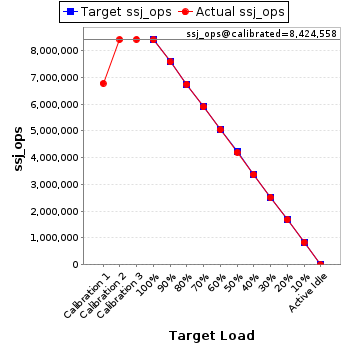
| Target Load | Actual Load | ssj_ops | |
|---|---|---|---|
| Target | Actual | ||
| Calibration 1 | 6,796,375 | ||
| Calibration 2 | 8,427,852 | ||
| Calibration 3 | 8,432,853 | ||
| ssj_ops@calibrated=8,430,352 | |||
| 100% | 99.7% | 8,430,352 | 8,402,049 |
| 90% | 90.0% | 7,587,317 | 7,585,874 |
| 80% | 80.0% | 6,744,282 | 6,741,732 |
| 70% | 70.0% | 5,901,247 | 5,903,653 |
| 60% | 59.9% | 5,058,211 | 5,051,839 |
| 50% | 50.0% | 4,215,176 | 4,218,668 |
| 40% | 39.9% | 3,372,141 | 3,364,100 |
| 30% | 30.1% | 2,529,106 | 2,535,315 |
| 20% | 20.0% | 1,686,070 | 1,685,326 |
| 10% | 10.0% | 843,035 | 845,911 |
| Active Idle | 0 | 0 | |
