
SPECpower_ssj2008
Aggregate Performance Report
Copyright © 2007-2022 Standard Performance Evaluation Corporation
| Hewlett Packard Enterprise Synergy 480 Gen10 Plus Compute Module | ssj_ops@100% = 42,315,362 ssj_ops@100% per Host = 8,463,072 ssj_ops@100% per JVM = 105,788 |
||||
| Test Sponsor: | Hewlett Packard Enterprise | SPEC License #: | 3 | Test Method: | Multi Node |
| Tested By: | Hewlett Packard Enterprise | Test Location: | Houston, TX, USA | Test Date: | Dec 6, 2021 |
| Hardware Availability: | Apr-2021 | Software Availability: | Sep-2021 | Publication: | Feb 3, 2022 |
| System Source: | Single Supplier | System Designation: | Server | Power Provisioning: | Line-powered |
| Target Load | Actual Load | ssj_ops | |
|---|---|---|---|
| Target | Actual | ||
| Calibration 1 | 42,448,437 | ||
| Calibration 2 | 42,408,716 | ||
| Calibration 3 | 42,449,156 | ||
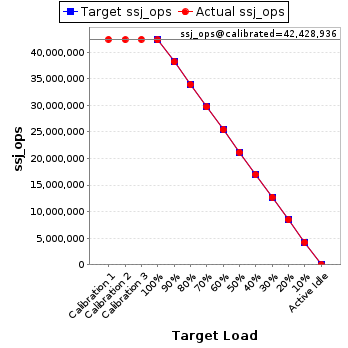
| ssj_ops@calibrated=42,428,936 | |||
| 100% | 99.7% | 42,428,936 | 42,315,362 |
| 90% | 90.0% | 38,186,042 | 38,199,077 |
| 80% | 80.0% | 33,943,149 | 33,944,513 |
| 70% | 70.0% | 29,700,255 | 29,696,103 |
| 60% | 60.0% | 25,457,362 | 25,450,396 |
| 50% | 50.0% | 21,214,468 | 21,211,920 |
| 40% | 40.0% | 16,971,574 | 16,970,389 |
| 30% | 30.0% | 12,728,681 | 12,734,915 |
| 20% | 20.0% | 8,485,787 | 8,487,869 |
| 10% | 10.0% | 4,242,894 | 4,240,453 |
| Active Idle | 0 | 0 | |
| # of Nodes | # of Chips | # of Cores | # of Threads | Total RAM (GB) | # of OS Images | # of JVM Instances |
|---|---|---|---|---|---|---|
| 5 | 10 | 400 | 800 | 1,280 | 5 | 400 |
| Set Identifier: | SUT |
| Set Description: | System Under Test |
| # of Identical Nodes: | 5 |
| Comment: | SUT |
| Hardware per Node | |
|---|---|
| Hardware Vendor: | Hewlett Packard Enterprise |
| Model: | Synergy 480 Gen10 Plus Compute Module |
| Form Factor: | Blade |
| CPU Name: | Intel Xeon Platinum 8380 CPU @ 2.30GHz (Intel Turbo Boost Technology up to 3.4GHz) |
| CPU Characteristics: | 40-Core, 2.30 GHz, 60MB L3 Cache |
| CPU Frequency (MHz): | 2300 |
| CPU(s) Enabled: | 80 cores, 2 chips, 40 cores/chip |
| Hardware Threads: | 160 (2 / core) |
| CPU(s) Orderable: | 1,2 chips |
| Primary Cache: | 32 KB I + 48 KB D on chip per core |
| Secondary Cache: | 1280 KB I+D on chip per core |
| Tertiary Cache: | 60 MB I+D on chip per chip |
| Other Cache: | None |
| Memory Amount (GB): | 256 |
| # and size of DIMM: | 16 x 16384 MB |
| Memory Details: | 16 x 16GB 2Rx8 PC4-3200-T; slots 1, 3, 5, 7, 10, 12, 14 & 16 on each socket |
| Power Supply Quantity and Rating (W): | None |
| Power Supply Details: | Shared |
| Disk Drive: | HPE 240GB SATA 6G Read Intensive SFF (P18420-B21) |
| Disk Controller: | Embedded SATA Controller |
| # and type of Network Interface Cards (NICs) Installed: | 1 x HPE Synergy 4820C 10/20/25Gb CNA |
| NICs Enabled in Firmware / OS / Connected: | 2/1/1 |
| Network Speed (Mbit): | 10000 |
| Keyboard: | None |
| Mouse: | None |
| Monitor: | None |
| Optical Drives: | No |
| Other Hardware: | None |
| Software per Node | |
|---|---|
| Power Management: | Enabled (see SUT Notes) |
| Operating System (OS): | Windows Server 2019 Datacenter |
| OS Version: | Version 1809 (Build 17763.2183) |
| Filesystem: | NTFS |
| JVM Vendor: | Oracle Corporation |
| JVM Version: | Oracle Java HotSpot(TM) 64-Bit Server VM 18.9 (build 11.0.11+9-LTS-194, mixed mode) |
| JVM Command-line Options: | -server -Xmn1700m -Xms1950m -Xmx1950m -XX:SurvivorRatio=1 -XX:TargetSurvivorRatio=99 -XX:ParallelGCThreads=2 -XX:AllocatePrefetchDistance=256 -XX:AllocatePrefetchLines=4 -XX:LoopUnrollLimit=45 -XX:InitialTenuringThreshold=12 -XX:MaxTenuringThreshold=15 -XX:InlineSmallCode=3900 -XX:MaxInlineSize=270 -XX:FreqInlineSize=2500 -XX:+UseLargePages -XX:+UseParallelOldGC -XX:UseAVX=0 -XX:-UseAdaptiveSizePolicy -XX:-ThreadLocalHandshakes |
| JVM Affinity: | start /NODE [0,1,2,3] /AFFINITY [3,C,30,C0,300,C00,3000,C000,30000,C0000,300000,C00000,3000000,C000000,30000000,C0000000,300000000,C00000000,3000000000,C000000000] |
| JVM Instances: | 80 |
| JVM Initial Heap (MB): | 1950 |
| JVM Maximum Heap (MB): | 1950 |
| JVM Address Bits: | 64 |
| Boot Firmware Version: | I44 v1.40 (03/05/2021) |
| Management Firmware Version: | 2.40 pass 31 Jan 05 2021 |
| Workload Version: | SSJ 1.2.10 |
| Director Location: | Controller |
| Other Software: | KB5005568 |
| Host | ssj_ops@100% |
|---|---|
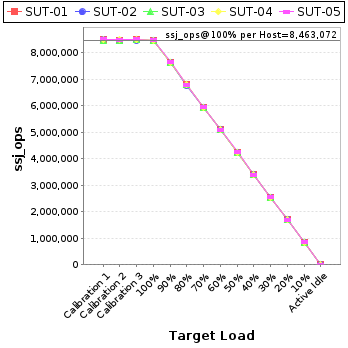
| SUT-01 | 8,455,777 |
| SUT-02 | 8,446,264 |
| SUT-03 | 8,459,889 |
| SUT-04 | 8,475,145 |
| SUT-05 | 8,478,288 |
| ssj_ops@100% | 42,315,362 |
| ssj_ops@100% per Host | 8,463,072 |
| ssj_ops@100% per JVM | 105,788 |
| Target Load | Actual Load | ssj_ops | |
|---|---|---|---|
| Target | Actual | ||
| Calibration 1 | 8,489,571 | ||
| Calibration 2 | 8,473,282 | ||
| Calibration 3 | 8,482,191 | ||
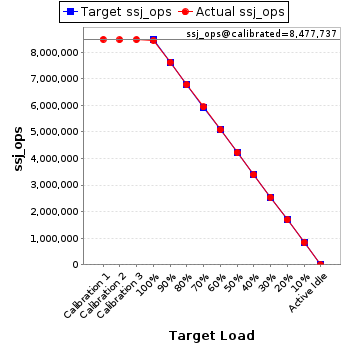
| ssj_ops@calibrated=8,477,737 | |||
| 100% | 99.7% | 8,477,737 | 8,455,777 |
| 90% | 90.0% | 7,629,963 | 7,631,031 |
| 80% | 80.0% | 6,782,189 | 6,784,766 |
| 70% | 70.1% | 5,934,416 | 5,940,509 |
| 60% | 60.0% | 5,086,642 | 5,082,902 |
| 50% | 49.9% | 4,238,868 | 4,232,016 |
| 40% | 40.0% | 3,391,095 | 3,388,258 |
| 30% | 30.0% | 2,543,321 | 2,546,039 |
| 20% | 20.0% | 1,695,547 | 1,697,092 |
| 10% | 10.0% | 847,774 | 846,099 |
| Active Idle | 0 | 0 | |
| Target Load | Actual Load | ssj_ops | |
|---|---|---|---|
| Target | Actual | ||
| Calibration 1 | 8,481,755 | ||
| Calibration 2 | 8,468,378 | ||
| Calibration 3 | 8,477,538 | ||
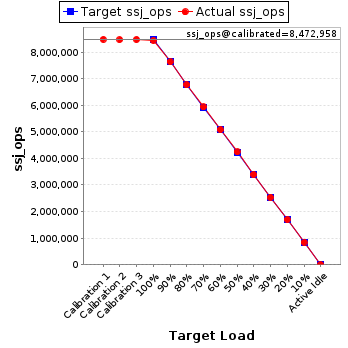
| ssj_ops@calibrated=8,472,958 | |||
| 100% | 99.7% | 8,472,958 | 8,446,264 |
| 90% | 90.1% | 7,625,662 | 7,635,223 |
| 80% | 79.9% | 6,778,367 | 6,772,761 |
| 70% | 70.0% | 5,931,071 | 5,933,022 |
| 60% | 60.0% | 5,083,775 | 5,083,362 |
| 50% | 50.1% | 4,236,479 | 4,242,828 |
| 40% | 40.0% | 3,389,183 | 3,393,164 |
| 30% | 30.0% | 2,541,887 | 2,541,874 |
| 20% | 20.1% | 1,694,592 | 1,700,778 |
| 10% | 10.0% | 847,296 | 847,284 |
| Active Idle | 0 | 0 | |
| Target Load | Actual Load | ssj_ops | |
|---|---|---|---|
| Target | Actual | ||
| Calibration 1 | 8,477,849 | ||
| Calibration 2 | 8,476,369 | ||
| Calibration 3 | 8,486,746 | ||
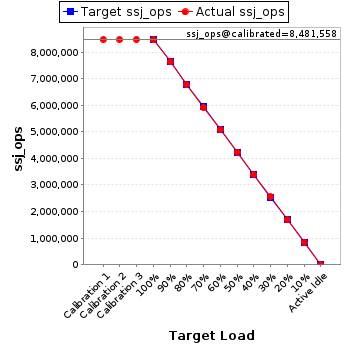
| ssj_ops@calibrated=8,481,558 | |||
| 100% | 99.7% | 8,481,558 | 8,459,889 |
| 90% | 90.0% | 7,633,402 | 7,630,870 |
| 80% | 80.0% | 6,785,246 | 6,786,362 |
| 70% | 69.9% | 5,937,090 | 5,931,784 |
| 60% | 60.0% | 5,088,935 | 5,087,691 |
| 50% | 50.0% | 4,240,779 | 4,240,608 |
| 40% | 40.0% | 3,392,623 | 3,394,874 |
| 30% | 30.1% | 2,544,467 | 2,550,162 |
| 20% | 20.0% | 1,696,312 | 1,693,789 |
| 10% | 10.0% | 848,156 | 848,849 |
| Active Idle | 0 | 0 | |
| Target Load | Actual Load | ssj_ops | |
|---|---|---|---|
| Target | Actual | ||
| Calibration 1 | 8,491,680 | ||
| Calibration 2 | 8,496,012 | ||
| Calibration 3 | 8,500,631 | ||
| ssj_ops@calibrated=8,498,321 | |||
| 100% | 99.7% | 8,498,321 | 8,475,145 |
| 90% | 90.0% | 7,648,489 | 7,647,090 |
| 80% | 80.1% | 6,798,657 | 6,803,513 |
| 70% | 70.0% | 5,948,825 | 5,946,159 |
| 60% | 60.0% | 5,098,993 | 5,101,568 |
| 50% | 49.9% | 4,249,161 | 4,243,152 |
| 40% | 40.0% | 3,399,329 | 3,395,353 |
| 30% | 30.0% | 2,549,496 | 2,550,181 |
| 20% | 20.0% | 1,699,664 | 1,697,442 |
| 10% | 10.0% | 849,832 | 849,284 |
| Active Idle | 0 | 0 | |

| Target Load | Actual Load | ssj_ops | |
|---|---|---|---|
| Target | Actual | ||
| Calibration 1 | 8,507,582 | ||
| Calibration 2 | 8,494,675 | ||
| Calibration 3 | 8,502,049 | ||
| ssj_ops@calibrated=8,498,362 | |||
| 100% | 99.8% | 8,498,362 | 8,478,288 |
| 90% | 90.1% | 7,648,526 | 7,654,863 |
| 80% | 80.0% | 6,798,689 | 6,797,112 |
| 70% | 70.0% | 5,948,853 | 5,944,629 |
| 60% | 60.0% | 5,099,017 | 5,094,874 |
| 50% | 50.0% | 4,249,181 | 4,253,316 |
| 40% | 40.0% | 3,399,345 | 3,398,739 |
| 30% | 30.0% | 2,549,509 | 2,546,659 |
| 20% | 20.0% | 1,699,672 | 1,698,768 |
| 10% | 10.0% | 849,836 | 848,936 |
| Active Idle | 0 | 0 | |
