SPECpower_ssj2008
Host 'GinGo' Performance Report
Copyright © 2007-2020 Standard Performance Evaluation Corporation
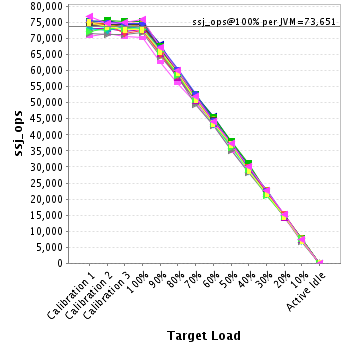
| Nokia Corporation AE-SER1U-A | ssj_ops@100% = 1,473,021 ssj_ops@100% per JVM = 73,651 |
||||
| Test Sponsor: | Nokia Corporation | SPEC License #: | 6037 | Test Method: | Multi Node |
| Tested By: | Nokia Corporation | Test Location: | HangZhou, Zhejiang, China | Test Date: | Dec 23, 2019 |
| Hardware Availability: | Dec-2019 | Software Availability: | Dec-2019 | Publication: | Feb 14, 2020 |
| System Source: | Single Supplier | System Designation: | Server | Power Provisioning: | Line-powered |
| Target Load | Actual Load | ssj_ops | |
|---|---|---|---|
| Target | Actual | ||
| Calibration 1 | 1,480,256 | ||
| Calibration 2 | 1,477,442 | ||
| Calibration 3 | 1,468,459 | ||
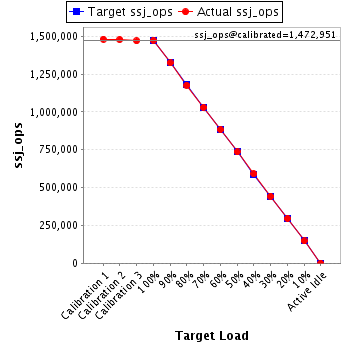
| ssj_ops@calibrated=1,472,951 | |||
| 100% | 100.0% | 1,472,951 | 1,473,021 |
| 90% | 89.8% | 1,325,656 | 1,323,258 |
| 80% | 79.9% | 1,178,361 | 1,176,201 |
| 70% | 69.9% | 1,031,065 | 1,029,262 |
| 60% | 59.9% | 883,770 | 882,730 |
| 50% | 49.9% | 736,475 | 734,966 |
| 40% | 40.1% | 589,180 | 590,202 |
| 30% | 30.1% | 441,885 | 442,758 |
| 20% | 20.0% | 294,590 | 295,268 |
| 10% | 10.0% | 147,295 | 147,142 |
| Active Idle | 0 | 0 | |
| Set Identifier: | sut |
| Set Description: | System Under Test |
| # of Identical Nodes: | 5 |
| Comment: | 'SUT' |
| Hardware | |
|---|---|
| Hardware Vendor: | Nokia Corporation |
| Model: | AE-SER1U-A |
| Form Factor: | 3U |
| CPU Name: | Intel(R) Xeon(R) Gold 6210U CPU @ 2.50GHz |
| CPU Characteristics: | 20 Core, 2.5GHz, 27.5MB L3 Cache |
| CPU Frequency (MHz): | 2500 |
| CPU(s) Enabled: | 20 cores, 1 chip, 20 cores/chip |
| Hardware Threads: | 40 (2 / core) |
| CPU(s) Orderable: | 1 chip |
| Primary Cache: | 32 KB I + 32 KB D on chip per core |
| Secondary Cache: | 1 MB I+D on chip per core |
| Tertiary Cache: | 28160 KB I+D on chip per chip |
| Other Cache: | None |
| Memory Amount (GB): | 64 |
| # and size of DIMM: | 4 x 16 GB |
| Memory Details: | 4 x 16 GB 2Rx4 PC4-2933Y-RB2-12-DC1; slots 0,1,4 and 5 populated |
| Power Supply Quantity and Rating (W): | None |
| Power Supply Details: | Shared |
| Disk Drive: | 1 x M.2 SSD 480G, Intel S4510 P/N: SSDSCKJB480G7 |
| Disk Controller: | Integrated SATA controller |
| # and type of Network Interface Cards (NICs) Installed: | 1 x Intel Corporation I210 Gigabit Network Connection(onboard) |
| NICs Enabled in Firmware / OS / Connected: | 1/1/1 |
| Network Speed (Mbit): | 1000 |
| Keyboard: | None |
| Mouse: | None |
| Monitor: | None |
| Optical Drives: | No |
| Other Hardware: | None |
| Software | |
|---|---|
| Power Management: | Enabled (see SUT Notes) |
| Operating System (OS): | CentOS Linux release 8.0.1905 (Core) |
| OS Version: | Kernel 4.18.0-80.el8.x86_64 |
| Filesystem: | EXT4 |
| JVM Vendor: | Oracle Corporation |
| JVM Version: | OpenJDK 64-Bit Server VM (build 25.181-b13, mixed mode),1.8.0_181 |
| JVM Command-line Options: | -Djava.awt.headless=true -server -Xms1300m -Xmx1300m -Xmn1100m -XX:SurvivorRatio=1 -XX:TargetSurvivorRatio=99 -XX:AllocatePrefetchDistance=256 -XX:AllocatePrefetchLines=4 -XX:LoopUnrollLimit=45 -XX:InitialTenuringThreshold=12 -XX:MaxTenuringThreshold=15 -XX:ParallelGCThreads=2 -XX:InlineSmallCode=3900 -XX:MaxInlineSize=270 -XX:FreqInlineSize=2500 -XX:+AggressiveOpts -XX:+UseLargePages -XX:+UseParallelOldGC |
| JVM Affinity: | None |
| JVM Instances: | 20 |
| JVM Initial Heap (MB): | 1300 |
| JVM Maximum Heap (MB): | 1300 |
| JVM Address Bits: | 64 |
| Boot Firmware Version: | 3B17(Oct-2019) |
| Management Firmware Version: | 3.42.00(Nov-2019) |
| Workload Version: | SSJ 1.2.10 |
| Director Location: | Controller |
| Other Software: | None |
| JVM Instance | ssj_ops@100% |
|---|---|
| GinGo.001 | 73,854 |
| GinGo.002 | 74,458 |
| GinGo.003 | 72,954 |
| GinGo.004 | 73,028 |
| GinGo.005 | 70,294 |
| GinGo.006 | 73,231 |
| GinGo.007 | 75,731 |
| GinGo.008 | 71,785 |
| GinGo.009 | 73,695 |
| GinGo.010 | 74,787 |
| GinGo.011 | 75,375 |
| GinGo.012 | 74,582 |
| GinGo.013 | 72,874 |
| GinGo.014 | 72,974 |
| GinGo.015 | 74,482 |
| GinGo.016 | 72,563 |
| GinGo.017 | 74,629 |
| GinGo.018 | 72,823 |
| GinGo.019 | 72,927 |
| GinGo.020 | 75,974 |
| ssj_ops@100% | 1,473,021 |
| ssj_ops@100% per JVM | 73,651 |
| Target Load | Actual Load | ssj_ops | |
|---|---|---|---|
| Target | Actual | ||
| Calibration 1 | 74,118 | ||
| Calibration 2 | 73,851 | ||
| Calibration 3 | 74,745 | ||
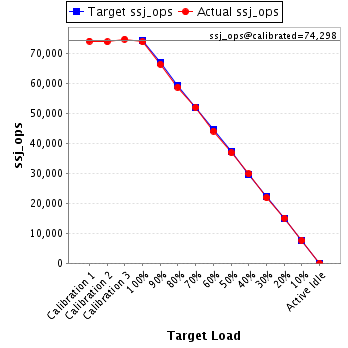
| ssj_ops@calibrated=74,298 | |||
| 100% | 99.4% | 74,298 | 73,854 |
| 90% | 89.3% | 66,868 | 66,322 |
| 80% | 79.0% | 59,438 | 58,687 |
| 70% | 70.0% | 52,009 | 51,976 |
| 60% | 59.4% | 44,579 | 44,113 |
| 50% | 49.6% | 37,149 | 36,854 |
| 40% | 40.1% | 29,719 | 29,774 |
| 30% | 29.4% | 22,289 | 21,872 |
| 20% | 20.3% | 14,860 | 15,062 |
| 10% | 10.2% | 7,430 | 7,608 |
| Active Idle | 0 | 0 | |
| Target Load | Actual Load | ssj_ops | |
|---|---|---|---|
| Target | Actual | ||
| Calibration 1 | 74,428 | ||
| Calibration 2 | 73,798 | ||
| Calibration 3 | 74,209 | ||
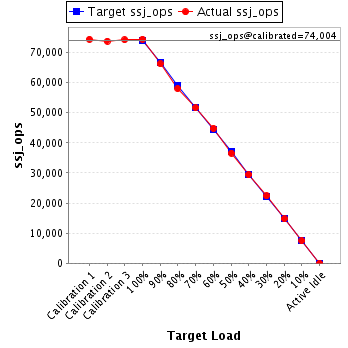
| ssj_ops@calibrated=74,004 | |||
| 100% | 100.6% | 74,004 | 74,458 |
| 90% | 89.5% | 66,603 | 66,235 |
| 80% | 78.4% | 59,203 | 58,008 |
| 70% | 69.8% | 51,802 | 51,621 |
| 60% | 60.5% | 44,402 | 44,802 |
| 50% | 49.5% | 37,002 | 36,609 |
| 40% | 39.7% | 29,601 | 29,399 |
| 30% | 30.2% | 22,201 | 22,364 |
| 20% | 19.9% | 14,801 | 14,750 |
| 10% | 10.1% | 7,400 | 7,479 |
| Active Idle | 0 | 0 | |
| Target Load | Actual Load | ssj_ops | |
|---|---|---|---|
| Target | Actual | ||
| Calibration 1 | 73,064 | ||
| Calibration 2 | 72,838 | ||
| Calibration 3 | 73,270 | ||
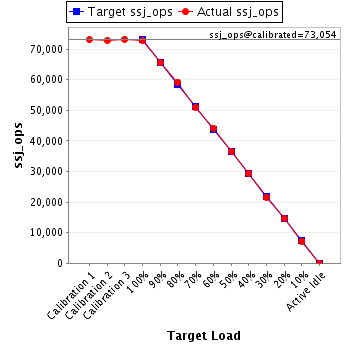
| ssj_ops@calibrated=73,054 | |||
| 100% | 99.9% | 73,054 | 72,954 |
| 90% | 89.7% | 65,749 | 65,523 |
| 80% | 81.1% | 58,443 | 59,240 |
| 70% | 69.9% | 51,138 | 51,083 |
| 60% | 60.5% | 43,832 | 44,197 |
| 50% | 50.1% | 36,527 | 36,633 |
| 40% | 40.2% | 29,222 | 29,354 |
| 30% | 29.6% | 21,916 | 21,652 |
| 20% | 20.0% | 14,611 | 14,642 |
| 10% | 10.0% | 7,305 | 7,271 |
| Active Idle | 0 | 0 | |
| Target Load | Actual Load | ssj_ops | |
|---|---|---|---|
| Target | Actual | ||
| Calibration 1 | 74,722 | ||
| Calibration 2 | 73,820 | ||
| Calibration 3 | 73,513 | ||
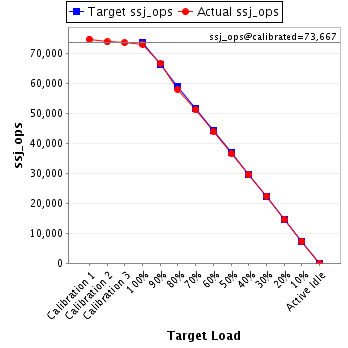
| ssj_ops@calibrated=73,667 | |||
| 100% | 99.1% | 73,667 | 73,028 |
| 90% | 90.4% | 66,300 | 66,559 |
| 80% | 78.7% | 58,933 | 57,990 |
| 70% | 69.5% | 51,567 | 51,178 |
| 60% | 59.5% | 44,200 | 43,831 |
| 50% | 49.6% | 36,833 | 36,521 |
| 40% | 40.3% | 29,467 | 29,663 |
| 30% | 30.4% | 22,100 | 22,408 |
| 20% | 20.0% | 14,733 | 14,721 |
| 10% | 9.9% | 7,367 | 7,317 |
| Active Idle | 0 | 0 | |
| Target Load | Actual Load | ssj_ops | |
|---|---|---|---|
| Target | Actual | ||
| Calibration 1 | 70,692 | ||
| Calibration 2 | 71,515 | ||
| Calibration 3 | 70,571 | ||
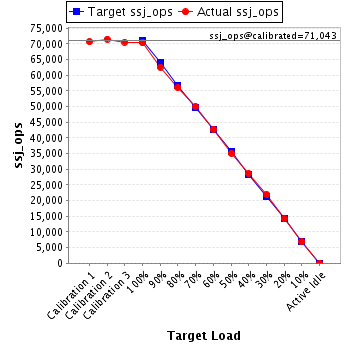
| ssj_ops@calibrated=71,043 | |||
| 100% | 98.9% | 71,043 | 70,294 |
| 90% | 88.1% | 63,939 | 62,592 |
| 80% | 78.9% | 56,835 | 56,066 |
| 70% | 70.4% | 49,730 | 50,020 |
| 60% | 60.2% | 42,626 | 42,794 |
| 50% | 49.4% | 35,522 | 35,112 |
| 40% | 40.3% | 28,417 | 28,652 |
| 30% | 30.9% | 21,313 | 21,930 |
| 20% | 19.9% | 14,209 | 14,163 |
| 10% | 9.6% | 7,104 | 6,792 |
| Active Idle | 0 | 0 | |
| Target Load | Actual Load | ssj_ops | |
|---|---|---|---|
| Target | Actual | ||
| Calibration 1 | 72,526 | ||
| Calibration 2 | 73,680 | ||
| Calibration 3 | 72,149 | ||
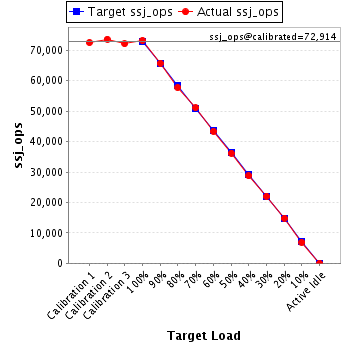
| ssj_ops@calibrated=72,914 | |||
| 100% | 100.4% | 72,914 | 73,231 |
| 90% | 90.2% | 65,623 | 65,774 |
| 80% | 79.3% | 58,331 | 57,792 |
| 70% | 70.1% | 51,040 | 51,085 |
| 60% | 59.5% | 43,748 | 43,359 |
| 50% | 49.6% | 36,457 | 36,173 |
| 40% | 39.4% | 29,166 | 28,729 |
| 30% | 30.3% | 21,874 | 22,059 |
| 20% | 20.3% | 14,583 | 14,829 |
| 10% | 9.5% | 7,291 | 6,896 |
| Active Idle | 0 | 0 | |
| Target Load | Actual Load | ssj_ops | |
|---|---|---|---|
| Target | Actual | ||
| Calibration 1 | 74,489 | ||
| Calibration 2 | 75,676 | ||
| Calibration 3 | 74,411 | ||
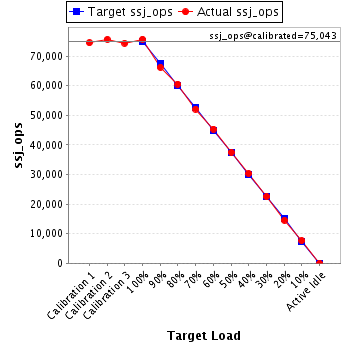
| ssj_ops@calibrated=75,043 | |||
| 100% | 100.9% | 75,043 | 75,731 |
| 90% | 88.3% | 67,539 | 66,245 |
| 80% | 80.7% | 60,035 | 60,577 |
| 70% | 69.4% | 52,530 | 52,112 |
| 60% | 60.4% | 45,026 | 45,362 |
| 50% | 50.0% | 37,522 | 37,537 |
| 40% | 40.4% | 30,017 | 30,346 |
| 30% | 30.1% | 22,513 | 22,579 |
| 20% | 19.4% | 15,009 | 14,587 |
| 10% | 10.3% | 7,504 | 7,700 |
| Active Idle | 0 | 0 | |
| Target Load | Actual Load | ssj_ops | |
|---|---|---|---|
| Target | Actual | ||
| Calibration 1 | 71,527 | ||
| Calibration 2 | 71,358 | ||
| Calibration 3 | 71,231 | ||
| ssj_ops@calibrated=71,295 | |||
| 100% | 100.7% | 71,295 | 71,785 |
| 90% | 90.3% | 64,165 | 64,405 |
| 80% | 81.4% | 57,036 | 58,022 |
| 70% | 69.6% | 49,906 | 49,595 |
| 60% | 60.1% | 42,777 | 42,870 |
| 50% | 49.2% | 35,647 | 35,112 |
| 40% | 39.7% | 28,518 | 28,271 |
| 30% | 30.2% | 21,388 | 21,519 |
| 20% | 20.5% | 14,259 | 14,650 |
| 10% | 9.7% | 7,129 | 6,917 |
| Active Idle | 0 | 0 | |

| Target Load | Actual Load | ssj_ops | |
|---|---|---|---|
| Target | Actual | ||
| Calibration 1 | 74,696 | ||
| Calibration 2 | 74,648 | ||
| Calibration 3 | 73,541 | ||
| ssj_ops@calibrated=74,094 | |||
| 100% | 99.5% | 74,094 | 73,695 |
| 90% | 90.3% | 66,685 | 66,896 |
| 80% | 79.2% | 59,275 | 58,695 |
| 70% | 69.7% | 51,866 | 51,679 |
| 60% | 59.7% | 44,456 | 44,237 |
| 50% | 50.3% | 37,047 | 37,254 |
| 40% | 39.8% | 29,638 | 29,491 |
| 30% | 30.4% | 22,228 | 22,525 |
| 20% | 19.8% | 14,819 | 14,706 |
| 10% | 10.5% | 7,409 | 7,750 |
| Active Idle | 0 | 0 | |

| Target Load | Actual Load | ssj_ops | |
|---|---|---|---|
| Target | Actual | ||
| Calibration 1 | 74,969 | ||
| Calibration 2 | 75,550 | ||
| Calibration 3 | 74,496 | ||
| ssj_ops@calibrated=75,023 | |||
| 100% | 99.7% | 75,023 | 74,787 |
| 90% | 90.7% | 67,521 | 68,021 |
| 80% | 78.8% | 60,019 | 59,099 |
| 70% | 69.8% | 52,516 | 52,362 |
| 60% | 60.9% | 45,014 | 45,690 |
| 50% | 50.2% | 37,512 | 37,667 |
| 40% | 40.5% | 30,009 | 30,417 |
| 30% | 29.6% | 22,507 | 22,220 |
| 20% | 19.9% | 15,005 | 14,933 |
| 10% | 9.8% | 7,502 | 7,340 |
| Active Idle | 0 | 0 | |

| Target Load | Actual Load | ssj_ops | |
|---|---|---|---|
| Target | Actual | ||
| Calibration 1 | 75,221 | ||
| Calibration 2 | 75,595 | ||
| Calibration 3 | 75,251 | ||
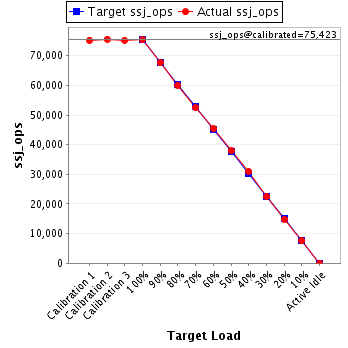
| ssj_ops@calibrated=75,423 | |||
| 100% | 99.9% | 75,423 | 75,375 |
| 90% | 89.7% | 67,881 | 67,638 |
| 80% | 79.7% | 60,338 | 60,108 |
| 70% | 69.5% | 52,796 | 52,451 |
| 60% | 60.2% | 45,254 | 45,375 |
| 50% | 50.2% | 37,712 | 37,878 |
| 40% | 41.0% | 30,169 | 30,958 |
| 30% | 29.8% | 22,627 | 22,508 |
| 20% | 19.7% | 15,085 | 14,883 |
| 10% | 10.1% | 7,542 | 7,608 |
| Active Idle | 0 | 0 | |
| Target Load | Actual Load | ssj_ops | |
|---|---|---|---|
| Target | Actual | ||
| Calibration 1 | 74,964 | ||
| Calibration 2 | 74,368 | ||
| Calibration 3 | 73,334 | ||
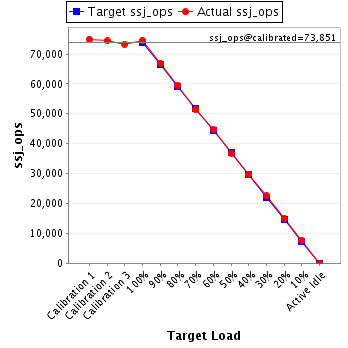
| ssj_ops@calibrated=73,851 | |||
| 100% | 101.0% | 73,851 | 74,582 |
| 90% | 90.5% | 66,466 | 66,816 |
| 80% | 80.6% | 59,081 | 59,525 |
| 70% | 69.7% | 51,696 | 51,465 |
| 60% | 60.5% | 44,311 | 44,668 |
| 50% | 49.9% | 36,925 | 36,845 |
| 40% | 40.3% | 29,540 | 29,756 |
| 30% | 30.6% | 22,155 | 22,575 |
| 20% | 20.3% | 14,770 | 14,983 |
| 10% | 10.4% | 7,385 | 7,646 |
| Active Idle | 0 | 0 | |
| Target Load | Actual Load | ssj_ops | |
|---|---|---|---|
| Target | Actual | ||
| Calibration 1 | 73,278 | ||
| Calibration 2 | 73,098 | ||
| Calibration 3 | 72,271 | ||
| ssj_ops@calibrated=72,685 | |||
| 100% | 100.3% | 72,685 | 72,874 |
| 90% | 90.0% | 65,416 | 65,421 |
| 80% | 79.5% | 58,148 | 57,809 |
| 70% | 69.7% | 50,879 | 50,695 |
| 60% | 59.9% | 43,611 | 43,560 |
| 50% | 50.4% | 36,342 | 36,628 |
| 40% | 40.0% | 29,074 | 29,072 |
| 30% | 29.8% | 21,805 | 21,662 |
| 20% | 19.6% | 14,537 | 14,246 |
| 10% | 10.2% | 7,268 | 7,417 |
| Active Idle | 0 | 0 | |

| Target Load | Actual Load | ssj_ops | |
|---|---|---|---|
| Target | Actual | ||
| Calibration 1 | 73,066 | ||
| Calibration 2 | 72,632 | ||
| Calibration 3 | 73,619 | ||
| ssj_ops@calibrated=73,125 | |||
| 100% | 99.8% | 73,125 | 72,974 |
| 90% | 91.0% | 65,813 | 66,551 |
| 80% | 79.8% | 58,500 | 58,338 |
| 70% | 70.2% | 51,188 | 51,301 |
| 60% | 59.2% | 43,875 | 43,287 |
| 50% | 50.1% | 36,563 | 36,617 |
| 40% | 39.8% | 29,250 | 29,092 |
| 30% | 29.4% | 21,938 | 21,525 |
| 20% | 20.1% | 14,625 | 14,682 |
| 10% | 9.6% | 7,313 | 6,987 |
| Active Idle | 0 | 0 | |

| Target Load | Actual Load | ssj_ops | |
|---|---|---|---|
| Target | Actual | ||
| Calibration 1 | 74,113 | ||
| Calibration 2 | 74,335 | ||
| Calibration 3 | 74,495 | ||
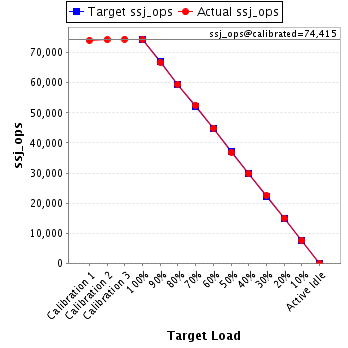
| ssj_ops@calibrated=74,415 | |||
| 100% | 100.1% | 74,415 | 74,482 |
| 90% | 89.9% | 66,974 | 66,871 |
| 80% | 79.9% | 59,532 | 59,490 |
| 70% | 70.6% | 52,091 | 52,518 |
| 60% | 60.4% | 44,649 | 44,916 |
| 50% | 49.6% | 37,208 | 36,904 |
| 40% | 40.2% | 29,766 | 29,892 |
| 30% | 30.2% | 22,325 | 22,467 |
| 20% | 20.2% | 14,883 | 15,009 |
| 10% | 10.2% | 7,442 | 7,583 |
| Active Idle | 0 | 0 | |
| Target Load | Actual Load | ssj_ops | |
|---|---|---|---|
| Target | Actual | ||
| Calibration 1 | 74,822 | ||
| Calibration 2 | 74,262 | ||
| Calibration 3 | 71,705 | ||
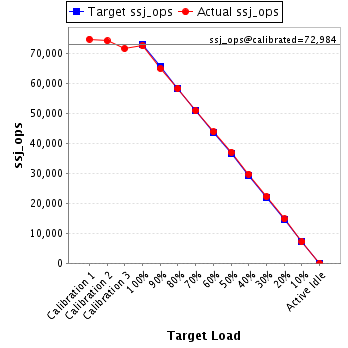
| ssj_ops@calibrated=72,984 | |||
| 100% | 99.4% | 72,984 | 72,563 |
| 90% | 89.1% | 65,685 | 65,027 |
| 80% | 79.9% | 58,387 | 58,339 |
| 70% | 69.8% | 51,089 | 50,942 |
| 60% | 60.1% | 43,790 | 43,858 |
| 50% | 50.8% | 36,492 | 37,054 |
| 40% | 40.8% | 29,193 | 29,773 |
| 30% | 30.5% | 21,895 | 22,263 |
| 20% | 20.3% | 14,597 | 14,787 |
| 10% | 9.8% | 7,298 | 7,167 |
| Active Idle | 0 | 0 | |
| Target Load | Actual Load | ssj_ops | |
|---|---|---|---|
| Target | Actual | ||
| Calibration 1 | 75,744 | ||
| Calibration 2 | 75,017 | ||
| Calibration 3 | 74,555 | ||
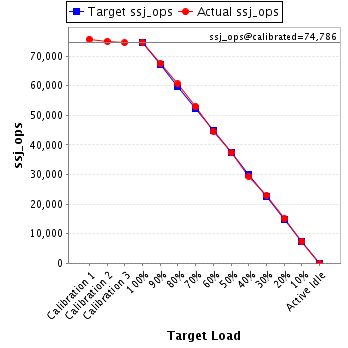
| ssj_ops@calibrated=74,786 | |||
| 100% | 99.8% | 74,786 | 74,629 |
| 90% | 90.1% | 67,307 | 67,414 |
| 80% | 81.0% | 59,828 | 60,611 |
| 70% | 70.7% | 52,350 | 52,888 |
| 60% | 59.7% | 44,871 | 44,625 |
| 50% | 49.8% | 37,393 | 37,277 |
| 40% | 39.3% | 29,914 | 29,426 |
| 30% | 30.6% | 22,436 | 22,892 |
| 20% | 20.1% | 14,957 | 15,029 |
| 10% | 10.0% | 7,479 | 7,446 |
| Active Idle | 0 | 0 | |
| Target Load | Actual Load | ssj_ops | |
|---|---|---|---|
| Target | Actual | ||
| Calibration 1 | 72,041 | ||
| Calibration 2 | 72,996 | ||
| Calibration 3 | 73,240 | ||
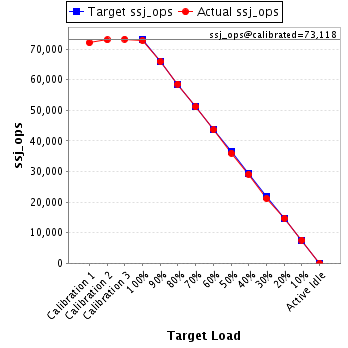
| ssj_ops@calibrated=73,118 | |||
| 100% | 99.6% | 73,118 | 72,823 |
| 90% | 90.1% | 65,806 | 65,905 |
| 80% | 80.1% | 58,495 | 58,574 |
| 70% | 69.9% | 51,183 | 51,143 |
| 60% | 59.6% | 43,871 | 43,606 |
| 50% | 49.2% | 36,559 | 35,946 |
| 40% | 39.8% | 29,247 | 29,096 |
| 30% | 29.0% | 21,935 | 21,212 |
| 20% | 20.1% | 14,624 | 14,675 |
| 10% | 10.4% | 7,312 | 7,574 |
| Active Idle | 0 | 0 | |
| Target Load | Actual Load | ssj_ops | |
|---|---|---|---|
| Target | Actual | ||
| Calibration 1 | 74,864 | ||
| Calibration 2 | 73,635 | ||
| Calibration 3 | 72,776 | ||
| ssj_ops@calibrated=73,205 | |||
| 100% | 99.6% | 73,205 | 72,927 |
| 90% | 90.0% | 65,885 | 65,874 |
| 80% | 81.0% | 58,564 | 59,292 |
| 70% | 69.8% | 51,244 | 51,096 |
| 60% | 59.5% | 43,923 | 43,530 |
| 50% | 50.5% | 36,603 | 36,967 |
| 40% | 39.7% | 29,282 | 29,050 |
| 30% | 29.9% | 21,962 | 21,867 |
| 20% | 20.1% | 14,641 | 14,692 |
| 10% | 9.8% | 7,321 | 7,190 |
| Active Idle | 0 | 0 | |

| Target Load | Actual Load | ssj_ops | |
|---|---|---|---|
| Target | Actual | ||
| Calibration 1 | 76,913 | ||
| Calibration 2 | 74,771 | ||
| Calibration 3 | 75,079 | ||
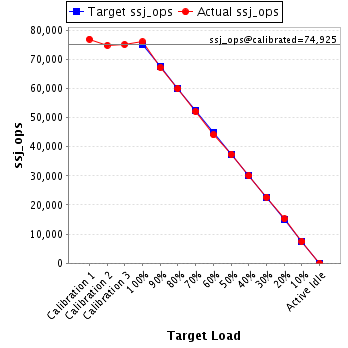
| ssj_ops@calibrated=74,925 | |||
| 100% | 101.4% | 74,925 | 75,974 |
| 90% | 89.6% | 67,432 | 67,168 |
| 80% | 80.0% | 59,940 | 59,938 |
| 70% | 69.5% | 52,447 | 52,052 |
| 60% | 58.8% | 44,955 | 44,050 |
| 50% | 49.9% | 37,462 | 37,378 |
| 40% | 40.0% | 29,970 | 29,992 |
| 30% | 30.2% | 22,477 | 22,660 |
| 20% | 20.3% | 14,985 | 15,237 |
| 10% | 9.9% | 7,492 | 7,454 |
| Active Idle | 0 | 0 | |