SPECpower_ssj2008
Host 'WIN-SUT116' Performance Report
Copyright © 2007-2019 Standard Performance Evaluation Corporation
| New H3C Technologies Co., Ltd. H3C UniServer B5700 G3 | ssj_ops@100% = 5,681,789 ssj_ops@100% per JVM = 1,420,447 |
||||
| Test Sponsor: | New H3C Technologies Co., Ltd. | SPEC License #: | 9066 | Test Method: | Multi Node |
| Tested By: | New H3C Technologies Co., Ltd. | Test Location: | Hangzhou, Zhejiang, China | Test Date: | May 24, 2019 |
| Hardware Availability: | Jan-2019 | Software Availability: | Jan-2019 | Publication: | Jun 26, 2019 |
| System Source: | Single Supplier | System Designation: | Server | Power Provisioning: | Line-powered |
| Target Load | Actual Load | ssj_ops | |
|---|---|---|---|
| Target | Actual | ||
| Calibration 1 | 5,695,149 | ||
| Calibration 2 | 5,684,940 | ||
| Calibration 3 | 5,691,362 | ||
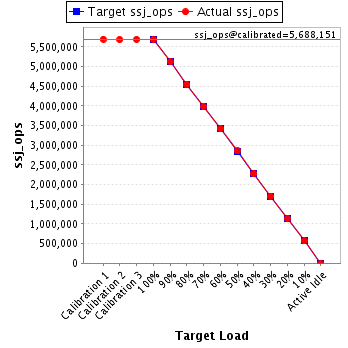
| ssj_ops@calibrated=5,688,151 | |||
| 100% | 99.9% | 5,688,151 | 5,681,789 |
| 90% | 90.0% | 5,119,336 | 5,120,504 |
| 80% | 80.0% | 4,550,521 | 4,551,265 |
| 70% | 70.0% | 3,981,706 | 3,980,860 |
| 60% | 60.1% | 3,412,891 | 3,418,830 |
| 50% | 50.2% | 2,844,076 | 2,853,616 |
| 40% | 40.0% | 2,275,260 | 2,274,598 |
| 30% | 30.0% | 1,706,445 | 1,708,828 |
| 20% | 20.0% | 1,137,630 | 1,136,246 |
| 10% | 10.0% | 568,815 | 567,834 |
| Active Idle | 0 | 0 | |
| Set Identifier: | sut |
| Set Description: | System Under Test |
| # of Identical Nodes: | 16 |
| Comment: | SUT |
| Hardware | |
|---|---|
| Hardware Vendor: | New H3C Technologies Co., Ltd. |
| Model: | H3C UniServer B5700 G3 |
| Form Factor: | other |
| CPU Name: | Intel Xeon Platinum 8180 2.50GHz |
| CPU Characteristics: | 28-Core, 2.50 GHz, 38.5 MB L3 Cache |
| CPU Frequency (MHz): | 2500 |
| CPU(s) Enabled: | 56 cores, 2 chips, 28 cores/chip |
| Hardware Threads: | 112 (2 / core) |
| CPU(s) Orderable: | 1,2 chips |
| Primary Cache: | 32 KB I + 32 KB D on chip per core |
| Secondary Cache: | 1 MB I+D on chip per core |
| Tertiary Cache: | 39424 KB I+D on chip per chip |
| Other Cache: | None |
| Memory Amount (GB): | 192.0 |
| # and size of DIMM: | 12 x 16384 MB |
| Memory Details: | 12 x 16GB 2Rx8 PC4-2666-V ECC;slots A1, A2, A3, A4, A5, A6, B1, B2, B3, B4, B5, B6 populated |
| Power Supply Quantity and Rating (W): | None |
| Power Supply Details: | Shared |
| Disk Drive: | SATA DOM 128GB P/N DESSH-A28D09BCADCA |
| Disk Controller: | Integrated SATA controller |
| # and type of Network Interface Cards (NICs) Installed: | 1 x Intel I350 Gigabit Ethernet Controller |
| NICs Enabled in Firmware / OS / Connected: | 2/2/1 |
| Network Speed (Mbit): | 1000 |
| Keyboard: | None |
| Mouse: | None |
| Monitor: | None |
| Optical Drives: | No |
| Other Hardware: | None |
| Software | |
|---|---|
| Power Management: | Balanced Mode enabled in OS (see SUT Notes) |
| Operating System (OS): | Microsoft Windows Server 2012 R2 Datacenter |
| OS Version: | Version 6.3 (Build 9600) |
| Filesystem: | NTFS |
| JVM Vendor: | Oracle Corporation |
| JVM Version: | Java HotSpot(TM) 64-Bit Server VM (build 24.80-b11, mixed mode), version 1.7.0_80 |
| JVM Command-line Options: | -server -Xmn19g -Xms21g -Xmx21g -XX:SurvivorRatio=1 -XX:TargetSurvivorRatio=99 -XX:ParallelGCThreads=28 -XX:AllocatePrefetchDistance=256 -XX:AllocatePrefetchLines=4 -XX:LoopUnrollLimit=45 -XX:InitialTenuringThreshold=12 -XX:MaxTenuringThreshold=15 -XX:InlineSmallCode=9000 -XX:MaxInlineSize=270 -XX:FreqInlineSize=6000 -XX:+UseLargePages -XX:+UseParallelOldGC -XX:+AggressiveOpts |
| JVM Affinity: | start /NODE [0,2] /AFFINITY [0xFC0FF00FC0FF];start /NODE [1,3] /AFFINITY [0xFF03F00FF03F] |
| JVM Instances: | 4 |
| JVM Initial Heap (MB): | 21000 |
| JVM Maximum Heap (MB): | 21000 |
| JVM Address Bits: | 64 |
| Boot Firmware Version: | 2.00.25 |
| Management Firmware Version: | UIS-OM 1.00.10 |
| Workload Version: | SSJ 1.2.10 |
| Director Location: | Controller |
| Other Software: | Microsoft Windows KB3021910, clearcompressionflag.exe, KB2919355, KB2932046, KB2959977, KB2937592, KB2938439, KB2934018, KB4056898, patched to this test system in May 16, 2019 |
| JVM Instance | ssj_ops@100% |
|---|---|
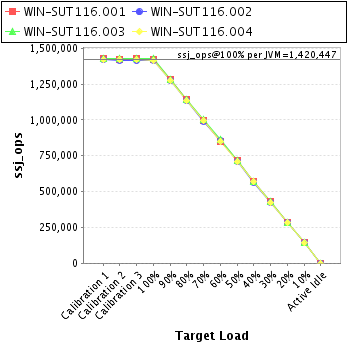
| WIN-SUT116.001 | 1,423,373 |
| WIN-SUT116.002 | 1,415,019 |
| WIN-SUT116.003 | 1,426,152 |
| WIN-SUT116.004 | 1,417,246 |
| ssj_ops@100% | 5,681,789 |
| ssj_ops@100% per JVM | 1,420,447 |
| Target Load | Actual Load | ssj_ops | |
|---|---|---|---|
| Target | Actual | ||
| Calibration 1 | 1,427,433 | ||
| Calibration 2 | 1,421,921 | ||
| Calibration 3 | 1,425,114 | ||
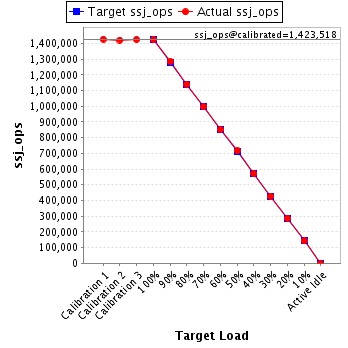
| ssj_ops@calibrated=1,423,518 | |||
| 100% | 100.0% | 1,423,518 | 1,423,373 |
| 90% | 90.3% | 1,281,166 | 1,284,982 |
| 80% | 80.1% | 1,138,814 | 1,140,513 |
| 70% | 70.0% | 996,462 | 996,385 |
| 60% | 59.9% | 854,111 | 852,769 |
| 50% | 50.3% | 711,759 | 715,778 |
| 40% | 40.0% | 569,407 | 570,086 |
| 30% | 30.1% | 427,055 | 427,952 |
| 20% | 20.0% | 284,704 | 285,368 |
| 10% | 10.0% | 142,352 | 141,855 |
| Active Idle | 0 | 0 | |
| Target Load | Actual Load | ssj_ops | |
|---|---|---|---|
| Target | Actual | ||
| Calibration 1 | 1,418,803 | ||
| Calibration 2 | 1,416,127 | ||
| Calibration 3 | 1,416,521 | ||
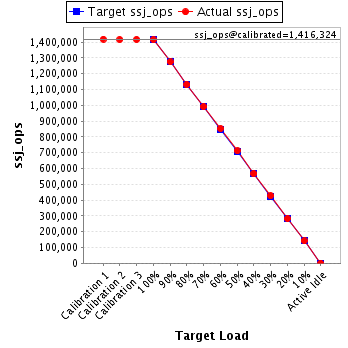
| ssj_ops@calibrated=1,416,324 | |||
| 100% | 99.9% | 1,416,324 | 1,415,019 |
| 90% | 90.0% | 1,274,691 | 1,275,211 |
| 80% | 79.9% | 1,133,059 | 1,131,973 |
| 70% | 70.0% | 991,427 | 992,082 |
| 60% | 60.2% | 849,794 | 852,956 |
| 50% | 50.2% | 708,162 | 711,459 |
| 40% | 40.0% | 566,530 | 566,760 |
| 30% | 30.1% | 424,897 | 426,465 |
| 20% | 19.9% | 283,265 | 281,938 |
| 10% | 10.0% | 141,632 | 141,589 |
| Active Idle | 0 | 0 | |
| Target Load | Actual Load | ssj_ops | |
|---|---|---|---|
| Target | Actual | ||
| Calibration 1 | 1,428,881 | ||
| Calibration 2 | 1,428,044 | ||
| Calibration 3 | 1,430,627 | ||
| ssj_ops@calibrated=1,429,336 | |||
| 100% | 99.8% | 1,429,336 | 1,426,152 |
| 90% | 89.7% | 1,286,402 | 1,282,087 |
| 80% | 80.1% | 1,143,469 | 1,145,061 |
| 70% | 69.9% | 1,000,535 | 999,725 |
| 60% | 60.2% | 857,601 | 860,398 |
| 50% | 50.2% | 714,668 | 717,273 |
| 40% | 39.8% | 571,734 | 569,238 |
| 30% | 30.1% | 428,801 | 430,279 |
| 20% | 20.0% | 285,867 | 285,810 |
| 10% | 10.0% | 142,934 | 142,642 |
| Active Idle | 0 | 0 | |

| Target Load | Actual Load | ssj_ops | |
|---|---|---|---|
| Target | Actual | ||
| Calibration 1 | 1,420,031 | ||
| Calibration 2 | 1,418,848 | ||
| Calibration 3 | 1,419,100 | ||
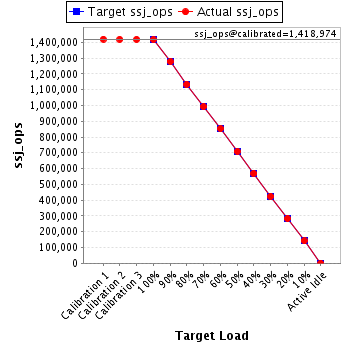
| ssj_ops@calibrated=1,418,974 | |||
| 100% | 99.9% | 1,418,974 | 1,417,246 |
| 90% | 90.1% | 1,277,077 | 1,278,224 |
| 80% | 79.9% | 1,135,179 | 1,133,719 |
| 70% | 70.0% | 993,282 | 992,667 |
| 60% | 60.1% | 851,384 | 852,707 |
| 50% | 50.0% | 709,487 | 709,105 |
| 40% | 40.1% | 567,590 | 568,514 |
| 30% | 29.9% | 425,692 | 424,131 |
| 20% | 20.0% | 283,795 | 283,130 |
| 10% | 10.0% | 141,897 | 141,748 |
| Active Idle | 0 | 0 | |