SPECpower_ssj2008
Host 'WIN-SUT115' Performance Report
Copyright © 2007-2019 Standard Performance Evaluation Corporation
| New H3C Technologies Co., Ltd. H3C UniServer B5700 G3 | ssj_ops@100% = 5,692,972 ssj_ops@100% per JVM = 1,423,243 |
||||
| Test Sponsor: | New H3C Technologies Co., Ltd. | SPEC License #: | 9066 | Test Method: | Multi Node |
| Tested By: | New H3C Technologies Co., Ltd. | Test Location: | Hangzhou, Zhejiang, China | Test Date: | May 24, 2019 |
| Hardware Availability: | Jan-2019 | Software Availability: | Jan-2019 | Publication: | Jun 26, 2019 |
| System Source: | Single Supplier | System Designation: | Server | Power Provisioning: | Line-powered |
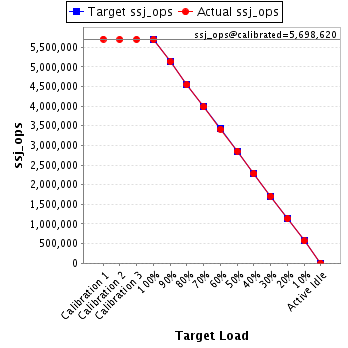
| Target Load | Actual Load | ssj_ops | |
|---|---|---|---|
| Target | Actual | ||
| Calibration 1 | 5,705,413 | ||
| Calibration 2 | 5,696,154 | ||
| Calibration 3 | 5,701,086 | ||
| ssj_ops@calibrated=5,698,620 | |||
| 100% | 99.9% | 5,698,620 | 5,692,972 |
| 90% | 90.1% | 5,128,758 | 5,133,248 |
| 80% | 79.7% | 4,558,896 | 4,544,221 |
| 70% | 69.8% | 3,989,034 | 3,980,447 |
| 60% | 59.9% | 3,419,172 | 3,416,239 |
| 50% | 50.1% | 2,849,310 | 2,853,872 |
| 40% | 40.0% | 2,279,448 | 2,279,429 |
| 30% | 30.0% | 1,709,586 | 1,708,419 |
| 20% | 20.0% | 1,139,724 | 1,138,032 |
| 10% | 10.0% | 569,862 | 570,377 |
| Active Idle | 0 | 0 | |
| Set Identifier: | sut |
| Set Description: | System Under Test |
| # of Identical Nodes: | 16 |
| Comment: | SUT |
| Hardware | |
|---|---|
| Hardware Vendor: | New H3C Technologies Co., Ltd. |
| Model: | H3C UniServer B5700 G3 |
| Form Factor: | other |
| CPU Name: | Intel Xeon Platinum 8180 2.50GHz |
| CPU Characteristics: | 28-Core, 2.50 GHz, 38.5 MB L3 Cache |
| CPU Frequency (MHz): | 2500 |
| CPU(s) Enabled: | 56 cores, 2 chips, 28 cores/chip |
| Hardware Threads: | 112 (2 / core) |
| CPU(s) Orderable: | 1,2 chips |
| Primary Cache: | 32 KB I + 32 KB D on chip per core |
| Secondary Cache: | 1 MB I+D on chip per core |
| Tertiary Cache: | 39424 KB I+D on chip per chip |
| Other Cache: | None |
| Memory Amount (GB): | 192.0 |
| # and size of DIMM: | 12 x 16384 MB |
| Memory Details: | 12 x 16GB 2Rx8 PC4-2666-V ECC;slots A1, A2, A3, A4, A5, A6, B1, B2, B3, B4, B5, B6 populated |
| Power Supply Quantity and Rating (W): | None |
| Power Supply Details: | Shared |
| Disk Drive: | SATA DOM 128GB P/N DESSH-A28D09BCADCA |
| Disk Controller: | Integrated SATA controller |
| # and type of Network Interface Cards (NICs) Installed: | 1 x Intel I350 Gigabit Ethernet Controller |
| NICs Enabled in Firmware / OS / Connected: | 2/2/1 |
| Network Speed (Mbit): | 1000 |
| Keyboard: | None |
| Mouse: | None |
| Monitor: | None |
| Optical Drives: | No |
| Other Hardware: | None |
| Software | |
|---|---|
| Power Management: | Balanced Mode enabled in OS (see SUT Notes) |
| Operating System (OS): | Microsoft Windows Server 2012 R2 Datacenter |
| OS Version: | Version 6.3 (Build 9600) |
| Filesystem: | NTFS |
| JVM Vendor: | Oracle Corporation |
| JVM Version: | Java HotSpot(TM) 64-Bit Server VM (build 24.80-b11, mixed mode), version 1.7.0_80 |
| JVM Command-line Options: | -server -Xmn19g -Xms21g -Xmx21g -XX:SurvivorRatio=1 -XX:TargetSurvivorRatio=99 -XX:ParallelGCThreads=28 -XX:AllocatePrefetchDistance=256 -XX:AllocatePrefetchLines=4 -XX:LoopUnrollLimit=45 -XX:InitialTenuringThreshold=12 -XX:MaxTenuringThreshold=15 -XX:InlineSmallCode=9000 -XX:MaxInlineSize=270 -XX:FreqInlineSize=6000 -XX:+UseLargePages -XX:+UseParallelOldGC -XX:+AggressiveOpts |
| JVM Affinity: | start /NODE [0,2] /AFFINITY [0xFC0FF00FC0FF];start /NODE [1,3] /AFFINITY [0xFF03F00FF03F] |
| JVM Instances: | 4 |
| JVM Initial Heap (MB): | 21000 |
| JVM Maximum Heap (MB): | 21000 |
| JVM Address Bits: | 64 |
| Boot Firmware Version: | 2.00.25 |
| Management Firmware Version: | UIS-OM 1.00.10 |
| Workload Version: | SSJ 1.2.10 |
| Director Location: | Controller |
| Other Software: | Microsoft Windows KB3021910, clearcompressionflag.exe, KB2919355, KB2932046, KB2959977, KB2937592, KB2938439, KB2934018, KB4056898, patched to this test system in May 16, 2019 |
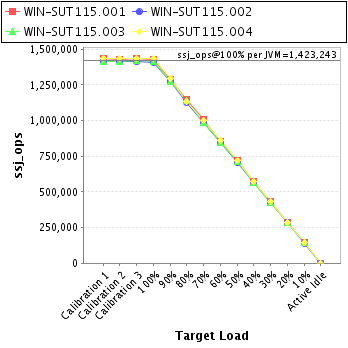
| JVM Instance | ssj_ops@100% |
|---|---|
| WIN-SUT115.001 | 1,430,183 |
| WIN-SUT115.002 | 1,411,081 |
| WIN-SUT115.003 | 1,416,930 |
| WIN-SUT115.004 | 1,434,778 |
| ssj_ops@100% | 5,692,972 |
| ssj_ops@100% per JVM | 1,423,243 |
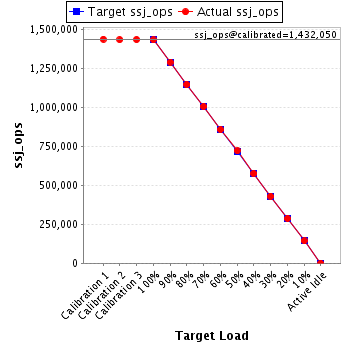
| Target Load | Actual Load | ssj_ops | |
|---|---|---|---|
| Target | Actual | ||
| Calibration 1 | 1,435,434 | ||
| Calibration 2 | 1,431,623 | ||
| Calibration 3 | 1,432,477 | ||
| ssj_ops@calibrated=1,432,050 | |||
| 100% | 99.9% | 1,432,050 | 1,430,183 |
| 90% | 90.0% | 1,288,845 | 1,289,097 |
| 80% | 80.0% | 1,145,640 | 1,145,104 |
| 70% | 70.2% | 1,002,435 | 1,004,860 |
| 60% | 59.8% | 859,230 | 856,009 |
| 50% | 50.3% | 716,025 | 719,796 |
| 40% | 40.1% | 572,820 | 574,179 |
| 30% | 30.0% | 429,615 | 429,775 |
| 20% | 20.0% | 286,410 | 286,332 |
| 10% | 10.0% | 143,205 | 143,450 |
| Active Idle | 0 | 0 | |
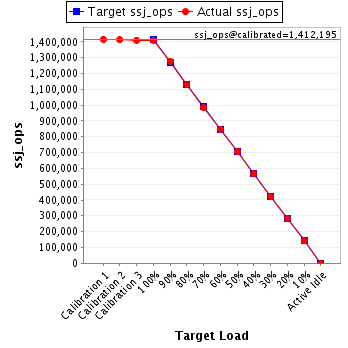
| Target Load | Actual Load | ssj_ops | |
|---|---|---|---|
| Target | Actual | ||
| Calibration 1 | 1,416,917 | ||
| Calibration 2 | 1,412,778 | ||
| Calibration 3 | 1,411,612 | ||
| ssj_ops@calibrated=1,412,195 | |||
| 100% | 99.9% | 1,412,195 | 1,411,081 |
| 90% | 90.4% | 1,270,975 | 1,276,676 |
| 80% | 79.9% | 1,129,756 | 1,128,701 |
| 70% | 69.8% | 988,536 | 985,142 |
| 60% | 60.1% | 847,317 | 848,777 |
| 50% | 49.9% | 706,097 | 705,121 |
| 40% | 40.0% | 564,878 | 565,382 |
| 30% | 30.0% | 423,658 | 423,506 |
| 20% | 20.1% | 282,439 | 283,842 |
| 10% | 10.0% | 141,219 | 141,449 |
| Active Idle | 0 | 0 | |
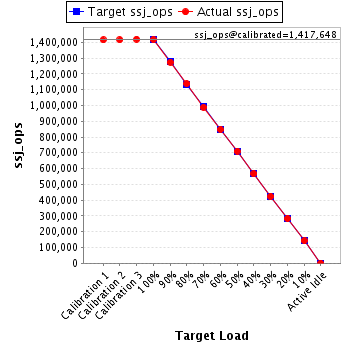
| Target Load | Actual Load | ssj_ops | |
|---|---|---|---|
| Target | Actual | ||
| Calibration 1 | 1,415,071 | ||
| Calibration 2 | 1,415,235 | ||
| Calibration 3 | 1,420,062 | ||
| ssj_ops@calibrated=1,417,648 | |||
| 100% | 99.9% | 1,417,648 | 1,416,930 |
| 90% | 89.8% | 1,275,884 | 1,273,711 |
| 80% | 80.3% | 1,134,119 | 1,138,032 |
| 70% | 69.8% | 992,354 | 988,873 |
| 60% | 59.8% | 850,589 | 848,339 |
| 50% | 50.1% | 708,824 | 710,513 |
| 40% | 40.0% | 567,059 | 566,654 |
| 30% | 29.9% | 425,295 | 423,889 |
| 20% | 19.9% | 283,530 | 282,636 |
| 10% | 10.1% | 141,765 | 142,683 |
| Active Idle | 0 | 0 | |
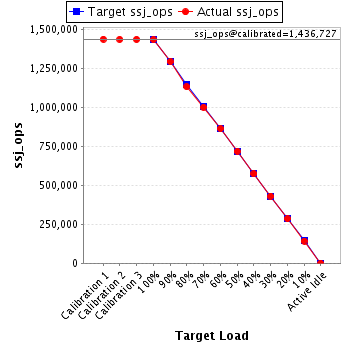
| Target Load | Actual Load | ssj_ops | |
|---|---|---|---|
| Target | Actual | ||
| Calibration 1 | 1,437,991 | ||
| Calibration 2 | 1,436,518 | ||
| Calibration 3 | 1,436,936 | ||
| ssj_ops@calibrated=1,436,727 | |||
| 100% | 99.9% | 1,436,727 | 1,434,778 |
| 90% | 90.0% | 1,293,054 | 1,293,764 |
| 80% | 78.8% | 1,149,381 | 1,132,384 |
| 70% | 69.7% | 1,005,709 | 1,001,572 |
| 60% | 60.1% | 862,036 | 863,115 |
| 50% | 50.0% | 718,363 | 718,443 |
| 40% | 39.9% | 574,691 | 573,215 |
| 30% | 30.0% | 431,018 | 431,249 |
| 20% | 19.9% | 287,345 | 285,222 |
| 10% | 9.9% | 143,673 | 142,795 |
| Active Idle | 0 | 0 | |