SPECpower_ssj2008
Host 'WIN-SUT114' Performance Report
Copyright © 2007-2019 Standard Performance Evaluation Corporation
| New H3C Technologies Co., Ltd. H3C UniServer B5700 G3 | ssj_ops@100% = 5,686,797 ssj_ops@100% per JVM = 1,421,699 |
||||
| Test Sponsor: | New H3C Technologies Co., Ltd. | SPEC License #: | 9066 | Test Method: | Multi Node |
| Tested By: | New H3C Technologies Co., Ltd. | Test Location: | Hangzhou, Zhejiang, China | Test Date: | May 24, 2019 |
| Hardware Availability: | Jan-2019 | Software Availability: | Jan-2019 | Publication: | Jun 26, 2019 |
| System Source: | Single Supplier | System Designation: | Server | Power Provisioning: | Line-powered |
| Target Load | Actual Load | ssj_ops | |
|---|---|---|---|
| Target | Actual | ||
| Calibration 1 | 5,697,509 | ||
| Calibration 2 | 5,688,668 | ||
| Calibration 3 | 5,695,487 | ||
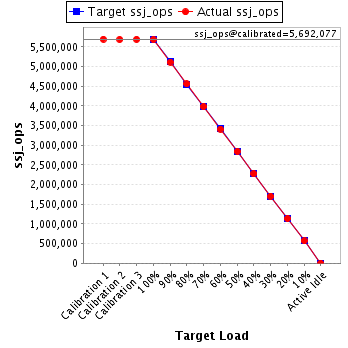
| ssj_ops@calibrated=5,692,077 | |||
| 100% | 99.9% | 5,692,077 | 5,686,797 |
| 90% | 89.9% | 5,122,870 | 5,115,145 |
| 80% | 80.1% | 4,553,662 | 4,561,740 |
| 70% | 70.0% | 3,984,454 | 3,986,317 |
| 60% | 60.0% | 3,415,246 | 3,413,190 |
| 50% | 50.0% | 2,846,039 | 2,843,310 |
| 40% | 39.9% | 2,276,831 | 2,273,539 |
| 30% | 30.0% | 1,707,623 | 1,706,452 |
| 20% | 19.9% | 1,138,415 | 1,134,619 |
| 10% | 10.0% | 569,208 | 568,375 |
| Active Idle | 0 | 0 | |
| Set Identifier: | sut |
| Set Description: | System Under Test |
| # of Identical Nodes: | 16 |
| Comment: | SUT |
| Hardware | |
|---|---|
| Hardware Vendor: | New H3C Technologies Co., Ltd. |
| Model: | H3C UniServer B5700 G3 |
| Form Factor: | other |
| CPU Name: | Intel Xeon Platinum 8180 2.50GHz |
| CPU Characteristics: | 28-Core, 2.50 GHz, 38.5 MB L3 Cache |
| CPU Frequency (MHz): | 2500 |
| CPU(s) Enabled: | 56 cores, 2 chips, 28 cores/chip |
| Hardware Threads: | 112 (2 / core) |
| CPU(s) Orderable: | 1,2 chips |
| Primary Cache: | 32 KB I + 32 KB D on chip per core |
| Secondary Cache: | 1 MB I+D on chip per core |
| Tertiary Cache: | 39424 KB I+D on chip per chip |
| Other Cache: | None |
| Memory Amount (GB): | 192.0 |
| # and size of DIMM: | 12 x 16384 MB |
| Memory Details: | 12 x 16GB 2Rx8 PC4-2666-V ECC;slots A1, A2, A3, A4, A5, A6, B1, B2, B3, B4, B5, B6 populated |
| Power Supply Quantity and Rating (W): | None |
| Power Supply Details: | Shared |
| Disk Drive: | SATA DOM 128GB P/N DESSH-A28D09BCADCA |
| Disk Controller: | Integrated SATA controller |
| # and type of Network Interface Cards (NICs) Installed: | 1 x Intel I350 Gigabit Ethernet Controller |
| NICs Enabled in Firmware / OS / Connected: | 2/2/1 |
| Network Speed (Mbit): | 1000 |
| Keyboard: | None |
| Mouse: | None |
| Monitor: | None |
| Optical Drives: | No |
| Other Hardware: | None |
| Software | |
|---|---|
| Power Management: | Balanced Mode enabled in OS (see SUT Notes) |
| Operating System (OS): | Microsoft Windows Server 2012 R2 Datacenter |
| OS Version: | Version 6.3 (Build 9600) |
| Filesystem: | NTFS |
| JVM Vendor: | Oracle Corporation |
| JVM Version: | Java HotSpot(TM) 64-Bit Server VM (build 24.80-b11, mixed mode), version 1.7.0_80 |
| JVM Command-line Options: | -server -Xmn19g -Xms21g -Xmx21g -XX:SurvivorRatio=1 -XX:TargetSurvivorRatio=99 -XX:ParallelGCThreads=28 -XX:AllocatePrefetchDistance=256 -XX:AllocatePrefetchLines=4 -XX:LoopUnrollLimit=45 -XX:InitialTenuringThreshold=12 -XX:MaxTenuringThreshold=15 -XX:InlineSmallCode=9000 -XX:MaxInlineSize=270 -XX:FreqInlineSize=6000 -XX:+UseLargePages -XX:+UseParallelOldGC -XX:+AggressiveOpts |
| JVM Affinity: | start /NODE [0,2] /AFFINITY [0xFC0FF00FC0FF];start /NODE [1,3] /AFFINITY [0xFF03F00FF03F] |
| JVM Instances: | 4 |
| JVM Initial Heap (MB): | 21000 |
| JVM Maximum Heap (MB): | 21000 |
| JVM Address Bits: | 64 |
| Boot Firmware Version: | 2.00.25 |
| Management Firmware Version: | UIS-OM 1.00.10 |
| Workload Version: | SSJ 1.2.10 |
| Director Location: | Controller |
| Other Software: | Microsoft Windows KB3021910, clearcompressionflag.exe, KB2919355, KB2932046, KB2959977, KB2937592, KB2938439, KB2934018, KB4056898, patched to this test system in May 16, 2019 |
| JVM Instance | ssj_ops@100% |
|---|---|
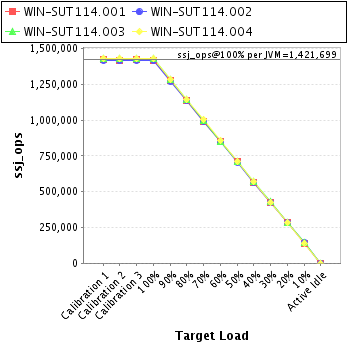
| WIN-SUT114.001 | 1,416,943 |
| WIN-SUT114.002 | 1,415,460 |
| WIN-SUT114.003 | 1,426,633 |
| WIN-SUT114.004 | 1,427,761 |
| ssj_ops@100% | 5,686,797 |
| ssj_ops@100% per JVM | 1,421,699 |
| Target Load | Actual Load | ssj_ops | |
|---|---|---|---|
| Target | Actual | ||
| Calibration 1 | 1,420,204 | ||
| Calibration 2 | 1,416,941 | ||
| Calibration 3 | 1,420,068 | ||
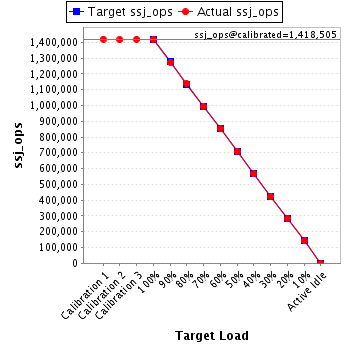
| ssj_ops@calibrated=1,418,505 | |||
| 100% | 99.9% | 1,418,505 | 1,416,943 |
| 90% | 89.9% | 1,276,654 | 1,274,911 |
| 80% | 80.3% | 1,134,804 | 1,138,549 |
| 70% | 70.0% | 992,953 | 993,125 |
| 60% | 60.1% | 851,103 | 853,029 |
| 50% | 50.1% | 709,252 | 710,978 |
| 40% | 39.9% | 567,402 | 566,264 |
| 30% | 29.9% | 425,551 | 423,885 |
| 20% | 20.0% | 283,701 | 283,250 |
| 10% | 10.0% | 141,850 | 141,384 |
| Active Idle | 0 | 0 | |
| Target Load | Actual Load | ssj_ops | |
|---|---|---|---|
| Target | Actual | ||
| Calibration 1 | 1,417,800 | ||
| Calibration 2 | 1,413,134 | ||
| Calibration 3 | 1,417,467 | ||
| ssj_ops@calibrated=1,415,300 | |||
| 100% | 100.0% | 1,415,300 | 1,415,460 |
| 90% | 89.8% | 1,273,770 | 1,271,271 |
| 80% | 80.2% | 1,132,240 | 1,135,457 |
| 70% | 69.9% | 990,710 | 989,542 |
| 60% | 59.9% | 849,180 | 848,403 |
| 50% | 49.9% | 707,650 | 705,955 |
| 40% | 39.9% | 566,120 | 565,218 |
| 30% | 29.9% | 424,590 | 422,645 |
| 20% | 19.9% | 283,060 | 282,112 |
| 10% | 10.1% | 141,530 | 142,536 |
| Active Idle | 0 | 0 | |

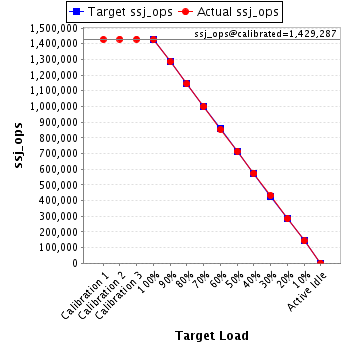
| Target Load | Actual Load | ssj_ops | |
|---|---|---|---|
| Target | Actual | ||
| Calibration 1 | 1,427,165 | ||
| Calibration 2 | 1,429,327 | ||
| Calibration 3 | 1,429,248 | ||
| ssj_ops@calibrated=1,429,287 | |||
| 100% | 99.8% | 1,429,287 | 1,426,633 |
| 90% | 89.9% | 1,286,359 | 1,285,420 |
| 80% | 80.0% | 1,143,430 | 1,143,890 |
| 70% | 70.0% | 1,000,501 | 999,800 |
| 60% | 59.7% | 857,572 | 853,625 |
| 50% | 49.9% | 714,644 | 713,603 |
| 40% | 40.1% | 571,715 | 573,069 |
| 30% | 30.2% | 428,786 | 432,216 |
| 20% | 19.9% | 285,857 | 284,181 |
| 10% | 10.0% | 142,929 | 143,130 |
| Active Idle | 0 | 0 | |
| Target Load | Actual Load | ssj_ops | |
|---|---|---|---|
| Target | Actual | ||
| Calibration 1 | 1,432,340 | ||
| Calibration 2 | 1,429,266 | ||
| Calibration 3 | 1,428,704 | ||
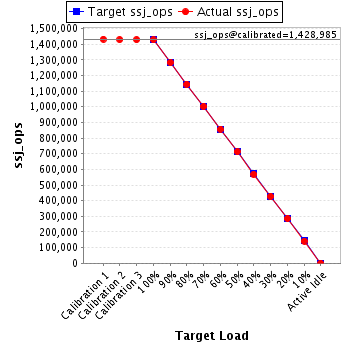
| ssj_ops@calibrated=1,428,985 | |||
| 100% | 99.9% | 1,428,985 | 1,427,761 |
| 90% | 89.8% | 1,286,086 | 1,283,543 |
| 80% | 80.0% | 1,143,188 | 1,143,844 |
| 70% | 70.2% | 1,000,289 | 1,003,850 |
| 60% | 60.1% | 857,391 | 858,133 |
| 50% | 49.9% | 714,492 | 712,774 |
| 40% | 39.8% | 571,594 | 568,988 |
| 30% | 29.9% | 428,695 | 427,706 |
| 20% | 19.9% | 285,797 | 285,075 |
| 10% | 9.9% | 142,898 | 141,324 |
| Active Idle | 0 | 0 | |