SPECpower_ssj2008
Host 'WIN-SUT112' Performance Report
Copyright © 2007-2019 Standard Performance Evaluation Corporation
| New H3C Technologies Co., Ltd. H3C UniServer B5700 G3 | ssj_ops@100% = 5,680,777 ssj_ops@100% per JVM = 1,420,194 |
||||
| Test Sponsor: | New H3C Technologies Co., Ltd. | SPEC License #: | 9066 | Test Method: | Multi Node |
| Tested By: | New H3C Technologies Co., Ltd. | Test Location: | Hangzhou, Zhejiang, China | Test Date: | May 24, 2019 |
| Hardware Availability: | Jan-2019 | Software Availability: | Jan-2019 | Publication: | Jun 26, 2019 |
| System Source: | Single Supplier | System Designation: | Server | Power Provisioning: | Line-powered |
| Target Load | Actual Load | ssj_ops | |
|---|---|---|---|
| Target | Actual | ||
| Calibration 1 | 5,693,625 | ||
| Calibration 2 | 5,681,461 | ||
| Calibration 3 | 5,689,356 | ||
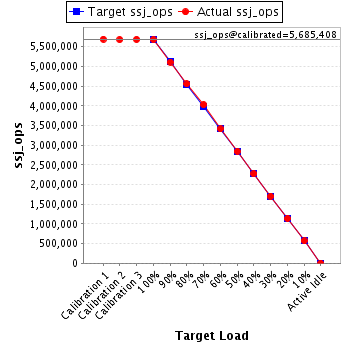
| ssj_ops@calibrated=5,685,408 | |||
| 100% | 99.9% | 5,685,408 | 5,680,777 |
| 90% | 89.9% | 5,116,867 | 5,110,279 |
| 80% | 80.2% | 4,548,327 | 4,557,128 |
| 70% | 70.8% | 3,979,786 | 4,028,022 |
| 60% | 60.0% | 3,411,245 | 3,411,502 |
| 50% | 50.0% | 2,842,704 | 2,844,396 |
| 40% | 39.9% | 2,274,163 | 2,270,815 |
| 30% | 30.0% | 1,705,622 | 1,707,072 |
| 20% | 20.0% | 1,137,082 | 1,135,698 |
| 10% | 10.0% | 568,541 | 569,176 |
| Active Idle | 0 | 0 | |
| Set Identifier: | sut |
| Set Description: | System Under Test |
| # of Identical Nodes: | 16 |
| Comment: | SUT |
| Hardware | |
|---|---|
| Hardware Vendor: | New H3C Technologies Co., Ltd. |
| Model: | H3C UniServer B5700 G3 |
| Form Factor: | other |
| CPU Name: | Intel Xeon Platinum 8180 2.50GHz |
| CPU Characteristics: | 28-Core, 2.50 GHz, 38.5 MB L3 Cache |
| CPU Frequency (MHz): | 2500 |
| CPU(s) Enabled: | 56 cores, 2 chips, 28 cores/chip |
| Hardware Threads: | 112 (2 / core) |
| CPU(s) Orderable: | 1,2 chips |
| Primary Cache: | 32 KB I + 32 KB D on chip per core |
| Secondary Cache: | 1 MB I+D on chip per core |
| Tertiary Cache: | 39424 KB I+D on chip per chip |
| Other Cache: | None |
| Memory Amount (GB): | 192.0 |
| # and size of DIMM: | 12 x 16384 MB |
| Memory Details: | 12 x 16GB 2Rx8 PC4-2666-V ECC;slots A1, A2, A3, A4, A5, A6, B1, B2, B3, B4, B5, B6 populated |
| Power Supply Quantity and Rating (W): | None |
| Power Supply Details: | Shared |
| Disk Drive: | SATA DOM 128GB P/N DESSH-A28D09BCADCA |
| Disk Controller: | Integrated SATA controller |
| # and type of Network Interface Cards (NICs) Installed: | 1 x Intel I350 Gigabit Ethernet Controller |
| NICs Enabled in Firmware / OS / Connected: | 2/2/1 |
| Network Speed (Mbit): | 1000 |
| Keyboard: | None |
| Mouse: | None |
| Monitor: | None |
| Optical Drives: | No |
| Other Hardware: | None |
| Software | |
|---|---|
| Power Management: | Balanced Mode enabled in OS (see SUT Notes) |
| Operating System (OS): | Microsoft Windows Server 2012 R2 Datacenter |
| OS Version: | Version 6.3 (Build 9600) |
| Filesystem: | NTFS |
| JVM Vendor: | Oracle Corporation |
| JVM Version: | Java HotSpot(TM) 64-Bit Server VM (build 24.80-b11, mixed mode), version 1.7.0_80 |
| JVM Command-line Options: | -server -Xmn19g -Xms21g -Xmx21g -XX:SurvivorRatio=1 -XX:TargetSurvivorRatio=99 -XX:ParallelGCThreads=28 -XX:AllocatePrefetchDistance=256 -XX:AllocatePrefetchLines=4 -XX:LoopUnrollLimit=45 -XX:InitialTenuringThreshold=12 -XX:MaxTenuringThreshold=15 -XX:InlineSmallCode=9000 -XX:MaxInlineSize=270 -XX:FreqInlineSize=6000 -XX:+UseLargePages -XX:+UseParallelOldGC -XX:+AggressiveOpts |
| JVM Affinity: | start /NODE [0,2] /AFFINITY [0xFC0FF00FC0FF];start /NODE [1,3] /AFFINITY [0xFF03F00FF03F] |
| JVM Instances: | 4 |
| JVM Initial Heap (MB): | 21000 |
| JVM Maximum Heap (MB): | 21000 |
| JVM Address Bits: | 64 |
| Boot Firmware Version: | 2.00.25 |
| Management Firmware Version: | UIS-OM 1.00.10 |
| Workload Version: | SSJ 1.2.10 |
| Director Location: | Controller |
| Other Software: | Microsoft Windows KB3021910, clearcompressionflag.exe, KB2919355, KB2932046, KB2959977, KB2937592, KB2938439, KB2934018, KB4056898, patched to this test system in May 16, 2019 |
| JVM Instance | ssj_ops@100% |
|---|---|
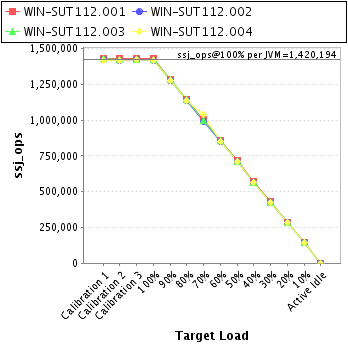
| WIN-SUT112.001 | 1,427,811 |
| WIN-SUT112.002 | 1,416,081 |
| WIN-SUT112.003 | 1,418,928 |
| WIN-SUT112.004 | 1,417,957 |
| ssj_ops@100% | 5,680,777 |
| ssj_ops@100% per JVM | 1,420,194 |
| Target Load | Actual Load | ssj_ops | |
|---|---|---|---|
| Target | Actual | ||
| Calibration 1 | 1,431,541 | ||
| Calibration 2 | 1,428,234 | ||
| Calibration 3 | 1,427,646 | ||
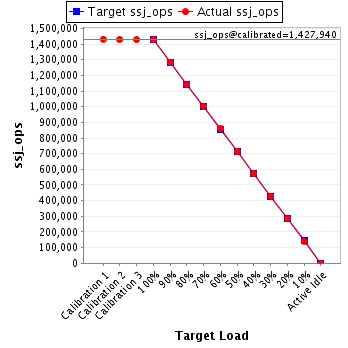
| ssj_ops@calibrated=1,427,940 | |||
| 100% | 100.0% | 1,427,940 | 1,427,811 |
| 90% | 90.0% | 1,285,146 | 1,285,234 |
| 80% | 80.0% | 1,142,352 | 1,142,009 |
| 70% | 70.2% | 999,558 | 1,001,849 |
| 60% | 60.1% | 856,764 | 858,276 |
| 50% | 50.1% | 713,970 | 714,763 |
| 40% | 40.0% | 571,176 | 570,632 |
| 30% | 30.0% | 428,382 | 429,074 |
| 20% | 19.9% | 285,588 | 284,846 |
| 10% | 9.9% | 142,794 | 141,638 |
| Active Idle | 0 | 0 | |
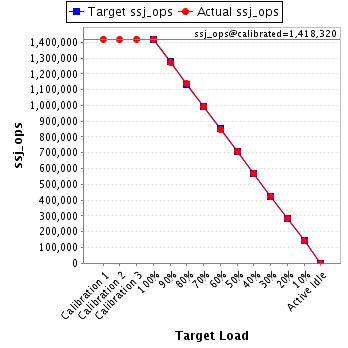
| Target Load | Actual Load | ssj_ops | |
|---|---|---|---|
| Target | Actual | ||
| Calibration 1 | 1,419,208 | ||
| Calibration 2 | 1,416,798 | ||
| Calibration 3 | 1,419,842 | ||
| ssj_ops@calibrated=1,418,320 | |||
| 100% | 99.8% | 1,418,320 | 1,416,081 |
| 90% | 89.8% | 1,276,488 | 1,273,365 |
| 80% | 80.3% | 1,134,656 | 1,138,679 |
| 70% | 70.0% | 992,824 | 992,746 |
| 60% | 59.9% | 850,992 | 849,473 |
| 50% | 50.1% | 709,160 | 709,872 |
| 40% | 39.9% | 567,328 | 566,110 |
| 30% | 30.0% | 425,496 | 426,100 |
| 20% | 19.9% | 283,664 | 282,908 |
| 10% | 10.1% | 141,832 | 142,707 |
| Active Idle | 0 | 0 | |
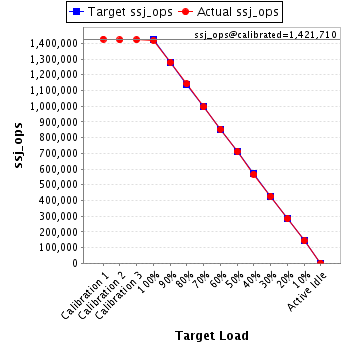
| Target Load | Actual Load | ssj_ops | |
|---|---|---|---|
| Target | Actual | ||
| Calibration 1 | 1,426,567 | ||
| Calibration 2 | 1,421,428 | ||
| Calibration 3 | 1,421,991 | ||
| ssj_ops@calibrated=1,421,710 | |||
| 100% | 99.8% | 1,421,710 | 1,418,928 |
| 90% | 90.0% | 1,279,539 | 1,279,422 |
| 80% | 80.3% | 1,137,368 | 1,142,324 |
| 70% | 70.0% | 995,197 | 994,764 |
| 60% | 60.1% | 853,026 | 854,147 |
| 50% | 50.0% | 710,855 | 711,359 |
| 40% | 39.9% | 568,684 | 566,909 |
| 30% | 30.0% | 426,513 | 426,806 |
| 20% | 19.9% | 284,342 | 283,154 |
| 10% | 10.1% | 142,171 | 143,277 |
| Active Idle | 0 | 0 | |
| Target Load | Actual Load | ssj_ops | |
|---|---|---|---|
| Target | Actual | ||
| Calibration 1 | 1,416,309 | ||
| Calibration 2 | 1,415,001 | ||
| Calibration 3 | 1,419,877 | ||
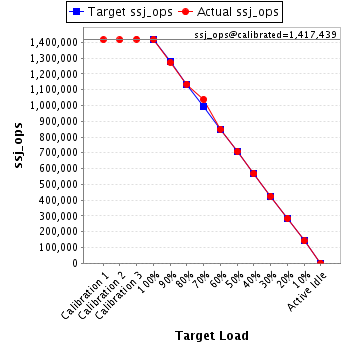
| ssj_ops@calibrated=1,417,439 | |||
| 100% | 100.0% | 1,417,439 | 1,417,957 |
| 90% | 89.8% | 1,275,695 | 1,272,258 |
| 80% | 80.0% | 1,133,951 | 1,134,115 |
| 70% | 73.3% | 992,207 | 1,038,663 |
| 60% | 59.9% | 850,463 | 849,607 |
| 50% | 50.0% | 708,719 | 708,403 |
| 40% | 40.0% | 566,976 | 567,164 |
| 30% | 30.0% | 425,232 | 425,092 |
| 20% | 20.1% | 283,488 | 284,790 |
| 10% | 10.0% | 141,744 | 141,553 |
| Active Idle | 0 | 0 | |