SPECpower_ssj2008
Host 'WIN-SUT110' Performance Report
Copyright © 2007-2019 Standard Performance Evaluation Corporation
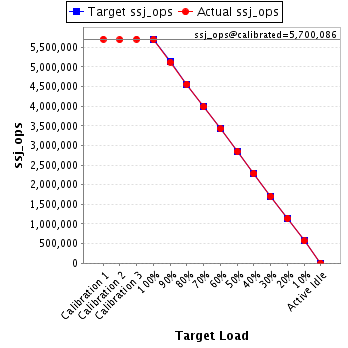
| New H3C Technologies Co., Ltd. H3C UniServer B5700 G3 | ssj_ops@100% = 5,697,078 ssj_ops@100% per JVM = 1,424,270 |
||||
| Test Sponsor: | New H3C Technologies Co., Ltd. | SPEC License #: | 9066 | Test Method: | Multi Node |
| Tested By: | New H3C Technologies Co., Ltd. | Test Location: | Hangzhou, Zhejiang, China | Test Date: | May 24, 2019 |
| Hardware Availability: | Jan-2019 | Software Availability: | Jan-2019 | Publication: | Jun 26, 2019 |
| System Source: | Single Supplier | System Designation: | Server | Power Provisioning: | Line-powered |
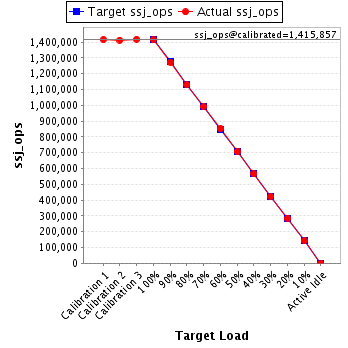
| Target Load | Actual Load | ssj_ops | |
|---|---|---|---|
| Target | Actual | ||
| Calibration 1 | 5,703,976 | ||
| Calibration 2 | 5,692,999 | ||
| Calibration 3 | 5,707,172 | ||
| ssj_ops@calibrated=5,700,086 | |||
| 100% | 99.9% | 5,700,086 | 5,697,078 |
| 90% | 89.8% | 5,130,077 | 5,118,834 |
| 80% | 80.0% | 4,560,068 | 4,559,894 |
| 70% | 69.9% | 3,990,060 | 3,985,992 |
| 60% | 60.1% | 3,420,051 | 3,424,107 |
| 50% | 49.9% | 2,850,043 | 2,846,692 |
| 40% | 40.1% | 2,280,034 | 2,283,250 |
| 30% | 29.9% | 1,710,026 | 1,707,074 |
| 20% | 20.0% | 1,140,017 | 1,141,624 |
| 10% | 10.0% | 570,009 | 570,226 |
| Active Idle | 0 | 0 | |
| Set Identifier: | sut |
| Set Description: | System Under Test |
| # of Identical Nodes: | 16 |
| Comment: | SUT |
| Hardware | |
|---|---|
| Hardware Vendor: | New H3C Technologies Co., Ltd. |
| Model: | H3C UniServer B5700 G3 |
| Form Factor: | other |
| CPU Name: | Intel Xeon Platinum 8180 2.50GHz |
| CPU Characteristics: | 28-Core, 2.50 GHz, 38.5 MB L3 Cache |
| CPU Frequency (MHz): | 2500 |
| CPU(s) Enabled: | 56 cores, 2 chips, 28 cores/chip |
| Hardware Threads: | 112 (2 / core) |
| CPU(s) Orderable: | 1,2 chips |
| Primary Cache: | 32 KB I + 32 KB D on chip per core |
| Secondary Cache: | 1 MB I+D on chip per core |
| Tertiary Cache: | 39424 KB I+D on chip per chip |
| Other Cache: | None |
| Memory Amount (GB): | 192.0 |
| # and size of DIMM: | 12 x 16384 MB |
| Memory Details: | 12 x 16GB 2Rx8 PC4-2666-V ECC;slots A1, A2, A3, A4, A5, A6, B1, B2, B3, B4, B5, B6 populated |
| Power Supply Quantity and Rating (W): | None |
| Power Supply Details: | Shared |
| Disk Drive: | SATA DOM 128GB P/N DESSH-A28D09BCADCA |
| Disk Controller: | Integrated SATA controller |
| # and type of Network Interface Cards (NICs) Installed: | 1 x Intel I350 Gigabit Ethernet Controller |
| NICs Enabled in Firmware / OS / Connected: | 2/2/1 |
| Network Speed (Mbit): | 1000 |
| Keyboard: | None |
| Mouse: | None |
| Monitor: | None |
| Optical Drives: | No |
| Other Hardware: | None |
| Software | |
|---|---|
| Power Management: | Balanced Mode enabled in OS (see SUT Notes) |
| Operating System (OS): | Microsoft Windows Server 2012 R2 Datacenter |
| OS Version: | Version 6.3 (Build 9600) |
| Filesystem: | NTFS |
| JVM Vendor: | Oracle Corporation |
| JVM Version: | Java HotSpot(TM) 64-Bit Server VM (build 24.80-b11, mixed mode), version 1.7.0_80 |
| JVM Command-line Options: | -server -Xmn19g -Xms21g -Xmx21g -XX:SurvivorRatio=1 -XX:TargetSurvivorRatio=99 -XX:ParallelGCThreads=28 -XX:AllocatePrefetchDistance=256 -XX:AllocatePrefetchLines=4 -XX:LoopUnrollLimit=45 -XX:InitialTenuringThreshold=12 -XX:MaxTenuringThreshold=15 -XX:InlineSmallCode=9000 -XX:MaxInlineSize=270 -XX:FreqInlineSize=6000 -XX:+UseLargePages -XX:+UseParallelOldGC -XX:+AggressiveOpts |
| JVM Affinity: | start /NODE [0,2] /AFFINITY [0xFC0FF00FC0FF];start /NODE [1,3] /AFFINITY [0xFF03F00FF03F] |
| JVM Instances: | 4 |
| JVM Initial Heap (MB): | 21000 |
| JVM Maximum Heap (MB): | 21000 |
| JVM Address Bits: | 64 |
| Boot Firmware Version: | 2.00.25 |
| Management Firmware Version: | UIS-OM 1.00.10 |
| Workload Version: | SSJ 1.2.10 |
| Director Location: | Controller |
| Other Software: | Microsoft Windows KB3021910, clearcompressionflag.exe, KB2919355, KB2932046, KB2959977, KB2937592, KB2938439, KB2934018, KB4056898, patched to this test system in May 16, 2019 |
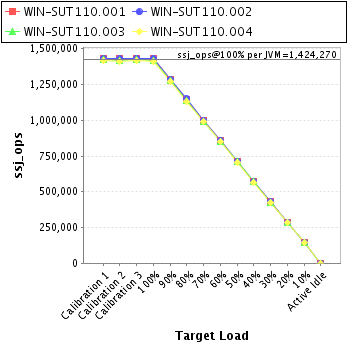
| JVM Instance | ssj_ops@100% |
|---|---|
| WIN-SUT110.001 | 1,432,351 |
| WIN-SUT110.002 | 1,430,296 |
| WIN-SUT110.003 | 1,420,242 |
| WIN-SUT110.004 | 1,414,188 |
| ssj_ops@100% | 5,697,078 |
| ssj_ops@100% per JVM | 1,424,270 |
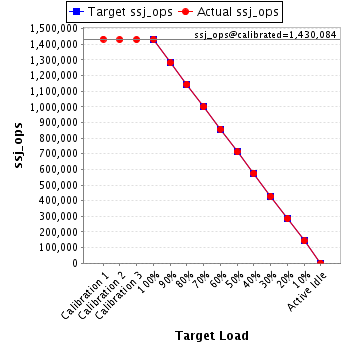
| Target Load | Actual Load | ssj_ops | |
|---|---|---|---|
| Target | Actual | ||
| Calibration 1 | 1,433,186 | ||
| Calibration 2 | 1,430,022 | ||
| Calibration 3 | 1,430,145 | ||
| ssj_ops@calibrated=1,430,084 | |||
| 100% | 100.2% | 1,430,084 | 1,432,351 |
| 90% | 89.7% | 1,287,075 | 1,282,542 |
| 80% | 80.0% | 1,144,067 | 1,144,172 |
| 70% | 70.0% | 1,001,059 | 1,000,381 |
| 60% | 60.0% | 858,050 | 858,409 |
| 50% | 49.8% | 715,042 | 712,449 |
| 40% | 40.2% | 572,034 | 574,631 |
| 30% | 30.0% | 429,025 | 428,619 |
| 20% | 20.0% | 286,017 | 285,854 |
| 10% | 10.0% | 143,008 | 143,440 |
| Active Idle | 0 | 0 | |
| Target Load | Actual Load | ssj_ops | |
|---|---|---|---|
| Target | Actual | ||
| Calibration 1 | 1,430,943 | ||
| Calibration 2 | 1,429,629 | ||
| Calibration 3 | 1,434,270 | ||
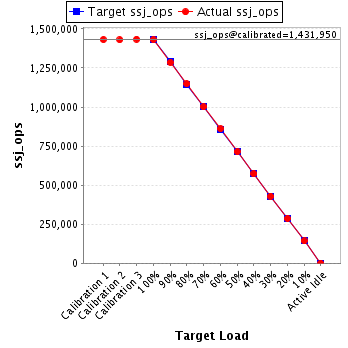
| ssj_ops@calibrated=1,431,950 | |||
| 100% | 99.9% | 1,431,950 | 1,430,296 |
| 90% | 89.7% | 1,288,755 | 1,285,018 |
| 80% | 80.2% | 1,145,560 | 1,148,973 |
| 70% | 69.9% | 1,002,365 | 1,000,584 |
| 60% | 60.1% | 859,170 | 861,235 |
| 50% | 49.8% | 715,975 | 713,636 |
| 40% | 39.9% | 572,780 | 571,871 |
| 30% | 30.0% | 429,585 | 429,885 |
| 20% | 20.0% | 286,390 | 285,943 |
| 10% | 10.0% | 143,195 | 142,676 |
| Active Idle | 0 | 0 | |
| Target Load | Actual Load | ssj_ops | |
|---|---|---|---|
| Target | Actual | ||
| Calibration 1 | 1,423,772 | ||
| Calibration 2 | 1,420,396 | ||
| Calibration 3 | 1,423,995 | ||
| ssj_ops@calibrated=1,422,195 | |||
| 100% | 99.9% | 1,422,195 | 1,420,242 |
| 90% | 89.9% | 1,279,976 | 1,278,286 |
| 80% | 80.0% | 1,137,756 | 1,137,758 |
| 70% | 69.8% | 995,537 | 993,190 |
| 60% | 60.0% | 853,317 | 853,966 |
| 50% | 50.1% | 711,098 | 713,139 |
| 40% | 40.2% | 568,878 | 571,421 |
| 30% | 30.0% | 426,659 | 426,948 |
| 20% | 20.0% | 284,439 | 284,876 |
| 10% | 10.0% | 142,220 | 141,884 |
| Active Idle | 0 | 0 | |

| Target Load | Actual Load | ssj_ops | |
|---|---|---|---|
| Target | Actual | ||
| Calibration 1 | 1,416,075 | ||
| Calibration 2 | 1,412,952 | ||
| Calibration 3 | 1,418,762 | ||
| ssj_ops@calibrated=1,415,857 | |||
| 100% | 99.9% | 1,415,857 | 1,414,188 |
| 90% | 89.9% | 1,274,271 | 1,272,987 |
| 80% | 79.7% | 1,132,686 | 1,128,990 |
| 70% | 70.1% | 991,100 | 991,838 |
| 60% | 60.1% | 849,514 | 850,497 |
| 50% | 50.0% | 707,929 | 707,469 |
| 40% | 39.9% | 566,343 | 565,327 |
| 30% | 29.8% | 424,757 | 421,622 |
| 20% | 20.1% | 283,171 | 284,950 |
| 10% | 10.0% | 141,586 | 142,226 |
| Active Idle | 0 | 0 | |