SPECpower_ssj2008
Host 'WIN-SUT109' Performance Report
Copyright © 2007-2019 Standard Performance Evaluation Corporation
| New H3C Technologies Co., Ltd. H3C UniServer B5700 G3 | ssj_ops@100% = 5,695,632 ssj_ops@100% per JVM = 1,423,908 |
||||
| Test Sponsor: | New H3C Technologies Co., Ltd. | SPEC License #: | 9066 | Test Method: | Multi Node |
| Tested By: | New H3C Technologies Co., Ltd. | Test Location: | Hangzhou, Zhejiang, China | Test Date: | May 24, 2019 |
| Hardware Availability: | Jan-2019 | Software Availability: | Jan-2019 | Publication: | Jun 26, 2019 |
| System Source: | Single Supplier | System Designation: | Server | Power Provisioning: | Line-powered |
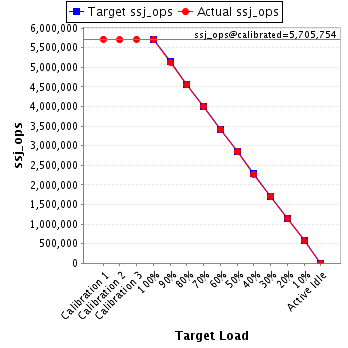
| Target Load | Actual Load | ssj_ops | |
|---|---|---|---|
| Target | Actual | ||
| Calibration 1 | 5,716,640 | ||
| Calibration 2 | 5,698,583 | ||
| Calibration 3 | 5,712,925 | ||
| ssj_ops@calibrated=5,705,754 | |||
| 100% | 99.8% | 5,705,754 | 5,695,632 |
| 90% | 89.9% | 5,135,179 | 5,129,555 |
| 80% | 79.9% | 4,564,603 | 4,556,594 |
| 70% | 70.0% | 3,994,028 | 3,993,499 |
| 60% | 59.9% | 3,423,452 | 3,417,095 |
| 50% | 49.9% | 2,852,877 | 2,849,164 |
| 40% | 39.9% | 2,282,302 | 2,276,259 |
| 30% | 30.0% | 1,711,726 | 1,710,565 |
| 20% | 19.9% | 1,141,151 | 1,138,294 |
| 10% | 10.0% | 570,575 | 571,145 |
| Active Idle | 0 | 0 | |
| Set Identifier: | sut |
| Set Description: | System Under Test |
| # of Identical Nodes: | 16 |
| Comment: | SUT |
| Hardware | |
|---|---|
| Hardware Vendor: | New H3C Technologies Co., Ltd. |
| Model: | H3C UniServer B5700 G3 |
| Form Factor: | other |
| CPU Name: | Intel Xeon Platinum 8180 2.50GHz |
| CPU Characteristics: | 28-Core, 2.50 GHz, 38.5 MB L3 Cache |
| CPU Frequency (MHz): | 2500 |
| CPU(s) Enabled: | 56 cores, 2 chips, 28 cores/chip |
| Hardware Threads: | 112 (2 / core) |
| CPU(s) Orderable: | 1,2 chips |
| Primary Cache: | 32 KB I + 32 KB D on chip per core |
| Secondary Cache: | 1 MB I+D on chip per core |
| Tertiary Cache: | 39424 KB I+D on chip per chip |
| Other Cache: | None |
| Memory Amount (GB): | 192.0 |
| # and size of DIMM: | 12 x 16384 MB |
| Memory Details: | 12 x 16GB 2Rx8 PC4-2666-V ECC;slots A1, A2, A3, A4, A5, A6, B1, B2, B3, B4, B5, B6 populated |
| Power Supply Quantity and Rating (W): | None |
| Power Supply Details: | Shared |
| Disk Drive: | SATA DOM 128GB P/N DESSH-A28D09BCADCA |
| Disk Controller: | Integrated SATA controller |
| # and type of Network Interface Cards (NICs) Installed: | 1 x Intel I350 Gigabit Ethernet Controller |
| NICs Enabled in Firmware / OS / Connected: | 2/2/1 |
| Network Speed (Mbit): | 1000 |
| Keyboard: | None |
| Mouse: | None |
| Monitor: | None |
| Optical Drives: | No |
| Other Hardware: | None |
| Software | |
|---|---|
| Power Management: | Balanced Mode enabled in OS (see SUT Notes) |
| Operating System (OS): | Microsoft Windows Server 2012 R2 Datacenter |
| OS Version: | Version 6.3 (Build 9600) |
| Filesystem: | NTFS |
| JVM Vendor: | Oracle Corporation |
| JVM Version: | Java HotSpot(TM) 64-Bit Server VM (build 24.80-b11, mixed mode), version 1.7.0_80 |
| JVM Command-line Options: | -server -Xmn19g -Xms21g -Xmx21g -XX:SurvivorRatio=1 -XX:TargetSurvivorRatio=99 -XX:ParallelGCThreads=28 -XX:AllocatePrefetchDistance=256 -XX:AllocatePrefetchLines=4 -XX:LoopUnrollLimit=45 -XX:InitialTenuringThreshold=12 -XX:MaxTenuringThreshold=15 -XX:InlineSmallCode=9000 -XX:MaxInlineSize=270 -XX:FreqInlineSize=6000 -XX:+UseLargePages -XX:+UseParallelOldGC -XX:+AggressiveOpts |
| JVM Affinity: | start /NODE [0,2] /AFFINITY [0xFC0FF00FC0FF];start /NODE [1,3] /AFFINITY [0xFF03F00FF03F] |
| JVM Instances: | 4 |
| JVM Initial Heap (MB): | 21000 |
| JVM Maximum Heap (MB): | 21000 |
| JVM Address Bits: | 64 |
| Boot Firmware Version: | 2.00.25 |
| Management Firmware Version: | UIS-OM 1.00.10 |
| Workload Version: | SSJ 1.2.10 |
| Director Location: | Controller |
| Other Software: | Microsoft Windows KB3021910, clearcompressionflag.exe, KB2919355, KB2932046, KB2959977, KB2937592, KB2938439, KB2934018, KB4056898, patched to this test system in May 16, 2019 |
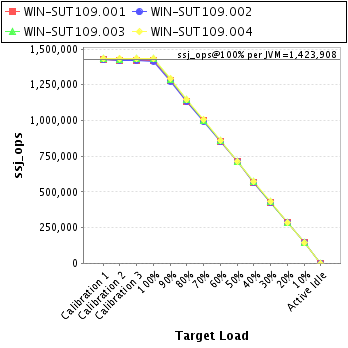
| JVM Instance | ssj_ops@100% |
|---|---|
| WIN-SUT109.001 | 1,416,628 |
| WIN-SUT109.002 | 1,415,948 |
| WIN-SUT109.003 | 1,431,699 |
| WIN-SUT109.004 | 1,431,358 |
| ssj_ops@100% | 5,695,632 |
| ssj_ops@100% per JVM | 1,423,908 |
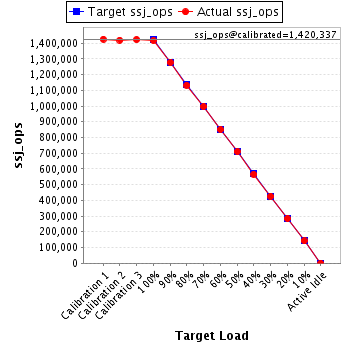
| Target Load | Actual Load | ssj_ops | |
|---|---|---|---|
| Target | Actual | ||
| Calibration 1 | 1,425,036 | ||
| Calibration 2 | 1,418,787 | ||
| Calibration 3 | 1,421,887 | ||
| ssj_ops@calibrated=1,420,337 | |||
| 100% | 99.7% | 1,420,337 | 1,416,628 |
| 90% | 89.9% | 1,278,303 | 1,277,440 |
| 80% | 79.7% | 1,136,269 | 1,131,904 |
| 70% | 70.2% | 994,236 | 996,910 |
| 60% | 59.9% | 852,202 | 850,806 |
| 50% | 50.0% | 710,168 | 709,603 |
| 40% | 39.8% | 568,135 | 565,958 |
| 30% | 30.0% | 426,101 | 426,461 |
| 20% | 20.0% | 284,067 | 284,029 |
| 10% | 10.0% | 142,034 | 141,969 |
| Active Idle | 0 | 0 | |
| Target Load | Actual Load | ssj_ops | |
|---|---|---|---|
| Target | Actual | ||
| Calibration 1 | 1,423,312 | ||
| Calibration 2 | 1,418,352 | ||
| Calibration 3 | 1,420,270 | ||
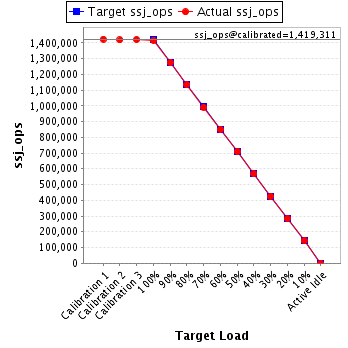
| ssj_ops@calibrated=1,419,311 | |||
| 100% | 99.8% | 1,419,311 | 1,415,948 |
| 90% | 89.8% | 1,277,380 | 1,274,240 |
| 80% | 79.9% | 1,135,449 | 1,133,646 |
| 70% | 69.9% | 993,518 | 991,504 |
| 60% | 59.9% | 851,587 | 849,537 |
| 50% | 50.0% | 709,655 | 709,624 |
| 40% | 40.0% | 567,724 | 567,288 |
| 30% | 29.9% | 425,793 | 424,731 |
| 20% | 19.9% | 283,862 | 282,311 |
| 10% | 10.1% | 141,931 | 143,305 |
| Active Idle | 0 | 0 | |
| Target Load | Actual Load | ssj_ops | |
|---|---|---|---|
| Target | Actual | ||
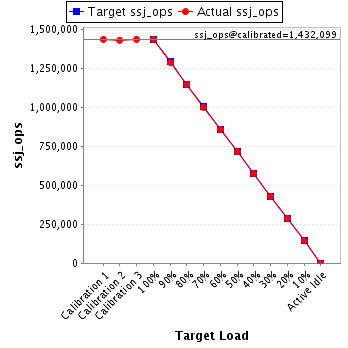
| Calibration 1 | 1,433,258 | ||
| Calibration 2 | 1,429,299 | ||
| Calibration 3 | 1,434,900 | ||
| ssj_ops@calibrated=1,432,099 | |||
| 100% | 100.0% | 1,432,099 | 1,431,699 |
| 90% | 89.7% | 1,288,889 | 1,285,100 |
| 80% | 80.0% | 1,145,680 | 1,145,478 |
| 70% | 69.9% | 1,002,470 | 1,000,534 |
| 60% | 59.8% | 859,260 | 856,641 |
| 50% | 49.9% | 716,050 | 714,390 |
| 40% | 39.9% | 572,840 | 571,733 |
| 30% | 30.0% | 429,630 | 428,926 |
| 20% | 20.0% | 286,420 | 286,606 |
| 10% | 10.0% | 143,210 | 142,828 |
| Active Idle | 0 | 0 | |
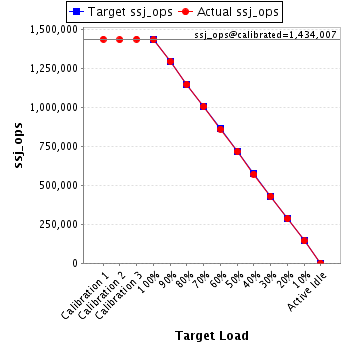
| Target Load | Actual Load | ssj_ops | |
|---|---|---|---|
| Target | Actual | ||
| Calibration 1 | 1,435,034 | ||
| Calibration 2 | 1,432,145 | ||
| Calibration 3 | 1,435,869 | ||
| ssj_ops@calibrated=1,434,007 | |||
| 100% | 99.8% | 1,434,007 | 1,431,358 |
| 90% | 90.2% | 1,290,606 | 1,292,776 |
| 80% | 79.9% | 1,147,206 | 1,145,567 |
| 70% | 70.1% | 1,003,805 | 1,004,550 |
| 60% | 60.0% | 860,404 | 860,110 |
| 50% | 49.9% | 717,004 | 715,547 |
| 40% | 39.8% | 573,603 | 571,279 |
| 30% | 30.0% | 430,202 | 430,448 |
| 20% | 19.9% | 286,801 | 285,348 |
| 10% | 10.0% | 143,401 | 143,043 |
| Active Idle | 0 | 0 | |