SPECpower_ssj2008
Host 'WIN-SUT108' Performance Report
Copyright © 2007-2019 Standard Performance Evaluation Corporation
| New H3C Technologies Co., Ltd. H3C UniServer B5700 G3 | ssj_ops@100% = 5,688,257 ssj_ops@100% per JVM = 1,422,064 |
||||
| Test Sponsor: | New H3C Technologies Co., Ltd. | SPEC License #: | 9066 | Test Method: | Multi Node |
| Tested By: | New H3C Technologies Co., Ltd. | Test Location: | Hangzhou, Zhejiang, China | Test Date: | May 24, 2019 |
| Hardware Availability: | Jan-2019 | Software Availability: | Jan-2019 | Publication: | Jun 26, 2019 |
| System Source: | Single Supplier | System Designation: | Server | Power Provisioning: | Line-powered |
| Target Load | Actual Load | ssj_ops | |
|---|---|---|---|
| Target | Actual | ||
| Calibration 1 | 5,718,645 | ||
| Calibration 2 | 5,702,283 | ||
| Calibration 3 | 5,716,500 | ||
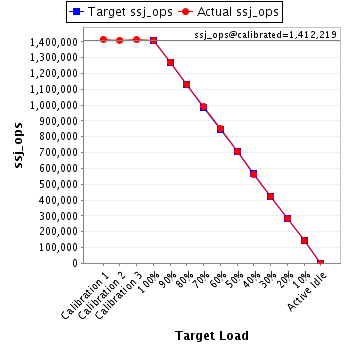
| ssj_ops@calibrated=5,709,392 | |||
| 100% | 99.6% | 5,709,392 | 5,688,257 |
| 90% | 90.0% | 5,138,452 | 5,140,994 |
| 80% | 80.0% | 4,567,513 | 4,567,547 |
| 70% | 69.9% | 3,996,574 | 3,989,707 |
| 60% | 60.1% | 3,425,635 | 3,432,455 |
| 50% | 50.4% | 2,854,696 | 2,880,120 |
| 40% | 40.0% | 2,283,757 | 2,282,395 |
| 30% | 30.0% | 1,712,817 | 1,711,084 |
| 20% | 20.0% | 1,141,878 | 1,144,172 |
| 10% | 10.0% | 570,939 | 571,265 |
| Active Idle | 0 | 0 | |
| Set Identifier: | sut |
| Set Description: | System Under Test |
| # of Identical Nodes: | 16 |
| Comment: | SUT |
| Hardware | |
|---|---|
| Hardware Vendor: | New H3C Technologies Co., Ltd. |
| Model: | H3C UniServer B5700 G3 |
| Form Factor: | other |
| CPU Name: | Intel Xeon Platinum 8180 2.50GHz |
| CPU Characteristics: | 28-Core, 2.50 GHz, 38.5 MB L3 Cache |
| CPU Frequency (MHz): | 2500 |
| CPU(s) Enabled: | 56 cores, 2 chips, 28 cores/chip |
| Hardware Threads: | 112 (2 / core) |
| CPU(s) Orderable: | 1,2 chips |
| Primary Cache: | 32 KB I + 32 KB D on chip per core |
| Secondary Cache: | 1 MB I+D on chip per core |
| Tertiary Cache: | 39424 KB I+D on chip per chip |
| Other Cache: | None |
| Memory Amount (GB): | 192.0 |
| # and size of DIMM: | 12 x 16384 MB |
| Memory Details: | 12 x 16GB 2Rx8 PC4-2666-V ECC;slots A1, A2, A3, A4, A5, A6, B1, B2, B3, B4, B5, B6 populated |
| Power Supply Quantity and Rating (W): | None |
| Power Supply Details: | Shared |
| Disk Drive: | SATA DOM 128GB P/N DESSH-A28D09BCADCA |
| Disk Controller: | Integrated SATA controller |
| # and type of Network Interface Cards (NICs) Installed: | 1 x Intel I350 Gigabit Ethernet Controller |
| NICs Enabled in Firmware / OS / Connected: | 2/2/1 |
| Network Speed (Mbit): | 1000 |
| Keyboard: | None |
| Mouse: | None |
| Monitor: | None |
| Optical Drives: | No |
| Other Hardware: | None |
| Software | |
|---|---|
| Power Management: | Balanced Mode enabled in OS (see SUT Notes) |
| Operating System (OS): | Microsoft Windows Server 2012 R2 Datacenter |
| OS Version: | Version 6.3 (Build 9600) |
| Filesystem: | NTFS |
| JVM Vendor: | Oracle Corporation |
| JVM Version: | Java HotSpot(TM) 64-Bit Server VM (build 24.80-b11, mixed mode), version 1.7.0_80 |
| JVM Command-line Options: | -server -Xmn19g -Xms21g -Xmx21g -XX:SurvivorRatio=1 -XX:TargetSurvivorRatio=99 -XX:ParallelGCThreads=28 -XX:AllocatePrefetchDistance=256 -XX:AllocatePrefetchLines=4 -XX:LoopUnrollLimit=45 -XX:InitialTenuringThreshold=12 -XX:MaxTenuringThreshold=15 -XX:InlineSmallCode=9000 -XX:MaxInlineSize=270 -XX:FreqInlineSize=6000 -XX:+UseLargePages -XX:+UseParallelOldGC -XX:+AggressiveOpts |
| JVM Affinity: | start /NODE [0,2] /AFFINITY [0xFC0FF00FC0FF];start /NODE [1,3] /AFFINITY [0xFF03F00FF03F] |
| JVM Instances: | 4 |
| JVM Initial Heap (MB): | 21000 |
| JVM Maximum Heap (MB): | 21000 |
| JVM Address Bits: | 64 |
| Boot Firmware Version: | 2.00.25 |
| Management Firmware Version: | UIS-OM 1.00.10 |
| Workload Version: | SSJ 1.2.10 |
| Director Location: | Controller |
| Other Software: | Microsoft Windows KB3021910, clearcompressionflag.exe, KB2919355, KB2932046, KB2959977, KB2937592, KB2938439, KB2934018, KB4056898, patched to this test system in May 16, 2019 |
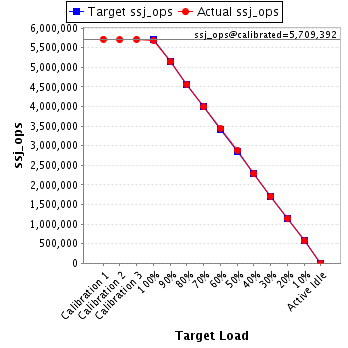
| JVM Instance | ssj_ops@100% |
|---|---|
| WIN-SUT108.001 | 1,429,570 |
| WIN-SUT108.002 | 1,417,804 |
| WIN-SUT108.003 | 1,430,396 |
| WIN-SUT108.004 | 1,410,487 |
| ssj_ops@100% | 5,688,257 |
| ssj_ops@100% per JVM | 1,422,064 |
| Target Load | Actual Load | ssj_ops | |
|---|---|---|---|
| Target | Actual | ||
| Calibration 1 | 1,434,652 | ||
| Calibration 2 | 1,433,029 | ||
| Calibration 3 | 1,437,607 | ||
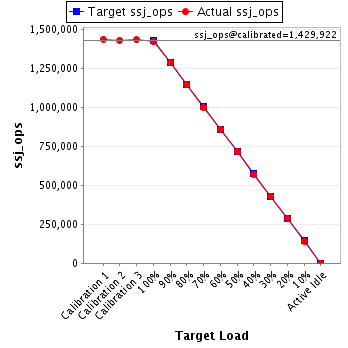
| ssj_ops@calibrated=1,435,318 | |||
| 100% | 99.6% | 1,435,318 | 1,429,570 |
| 90% | 90.0% | 1,291,787 | 1,291,986 |
| 80% | 79.9% | 1,148,255 | 1,146,501 |
| 70% | 70.0% | 1,004,723 | 1,004,408 |
| 60% | 60.0% | 861,191 | 861,720 |
| 50% | 49.8% | 717,659 | 714,622 |
| 40% | 39.9% | 574,127 | 573,017 |
| 30% | 29.9% | 430,596 | 429,547 |
| 20% | 19.9% | 287,064 | 286,271 |
| 10% | 10.0% | 143,532 | 143,734 |
| Active Idle | 0 | 0 | |
| Target Load | Actual Load | ssj_ops | |
|---|---|---|---|
| Target | Actual | ||
| Calibration 1 | 1,435,325 | ||
| Calibration 2 | 1,427,828 | ||
| Calibration 3 | 1,432,015 | ||
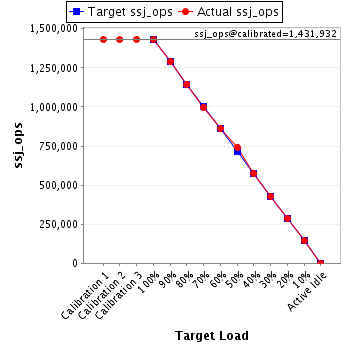
| ssj_ops@calibrated=1,429,922 | |||
| 100% | 99.2% | 1,429,922 | 1,417,804 |
| 90% | 90.0% | 1,286,930 | 1,287,217 |
| 80% | 80.0% | 1,143,937 | 1,143,815 |
| 70% | 69.8% | 1,000,945 | 998,700 |
| 60% | 60.1% | 857,953 | 859,936 |
| 50% | 50.0% | 714,961 | 714,895 |
| 40% | 39.9% | 571,969 | 571,204 |
| 30% | 30.0% | 428,977 | 428,830 |
| 20% | 20.0% | 285,984 | 286,608 |
| 10% | 9.9% | 142,992 | 142,242 |
| Active Idle | 0 | 0 | |
| Target Load | Actual Load | ssj_ops | |
|---|---|---|---|
| Target | Actual | ||
| Calibration 1 | 1,430,982 | ||
| Calibration 2 | 1,430,390 | ||
| Calibration 3 | 1,433,474 | ||
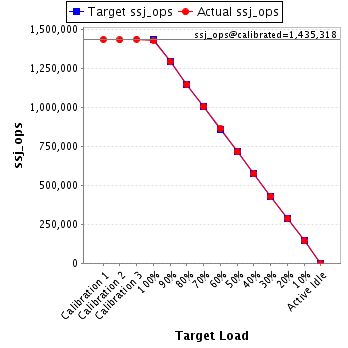
| ssj_ops@calibrated=1,431,932 | |||
| 100% | 99.9% | 1,431,932 | 1,430,396 |
| 90% | 90.0% | 1,288,739 | 1,288,767 |
| 80% | 80.0% | 1,145,545 | 1,146,193 |
| 70% | 69.7% | 1,002,352 | 997,606 |
| 60% | 60.2% | 859,159 | 861,401 |
| 50% | 51.8% | 715,966 | 742,114 |
| 40% | 40.1% | 572,773 | 573,703 |
| 30% | 30.0% | 429,580 | 429,535 |
| 20% | 20.1% | 286,386 | 288,212 |
| 10% | 10.0% | 143,193 | 143,598 |
| Active Idle | 0 | 0 | |
| Target Load | Actual Load | ssj_ops | |
|---|---|---|---|
| Target | Actual | ||
| Calibration 1 | 1,417,686 | ||
| Calibration 2 | 1,411,036 | ||
| Calibration 3 | 1,413,403 | ||
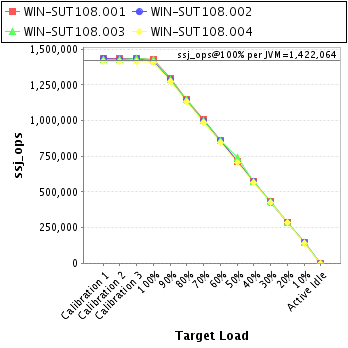
| ssj_ops@calibrated=1,412,219 | |||
| 100% | 99.9% | 1,412,219 | 1,410,487 |
| 90% | 90.1% | 1,270,998 | 1,273,024 |
| 80% | 80.1% | 1,129,776 | 1,131,038 |
| 70% | 70.0% | 988,554 | 988,993 |
| 60% | 60.1% | 847,332 | 849,398 |
| 50% | 50.2% | 706,110 | 708,488 |
| 40% | 40.0% | 564,888 | 564,471 |
| 30% | 30.0% | 423,666 | 423,172 |
| 20% | 20.0% | 282,444 | 283,080 |
| 10% | 10.0% | 141,222 | 141,690 |
| Active Idle | 0 | 0 | |