SPECpower_ssj2008
Host 'WIN-SUT107' Performance Report
Copyright © 2007-2019 Standard Performance Evaluation Corporation
| New H3C Technologies Co., Ltd. H3C UniServer B5700 G3 | ssj_ops@100% = 5,701,192 ssj_ops@100% per JVM = 1,425,298 |
||||
| Test Sponsor: | New H3C Technologies Co., Ltd. | SPEC License #: | 9066 | Test Method: | Multi Node |
| Tested By: | New H3C Technologies Co., Ltd. | Test Location: | Hangzhou, Zhejiang, China | Test Date: | May 24, 2019 |
| Hardware Availability: | Jan-2019 | Software Availability: | Jan-2019 | Publication: | Jun 26, 2019 |
| System Source: | Single Supplier | System Designation: | Server | Power Provisioning: | Line-powered |
| Target Load | Actual Load | ssj_ops | |
|---|---|---|---|
| Target | Actual | ||
| Calibration 1 | 5,717,675 | ||
| Calibration 2 | 5,708,193 | ||
| Calibration 3 | 5,708,587 | ||
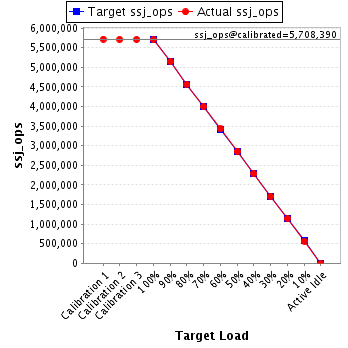
| ssj_ops@calibrated=5,708,390 | |||
| 100% | 99.9% | 5,708,390 | 5,701,192 |
| 90% | 90.1% | 5,137,551 | 5,143,449 |
| 80% | 80.0% | 4,566,712 | 4,566,448 |
| 70% | 70.0% | 3,995,873 | 3,996,129 |
| 60% | 60.0% | 3,425,034 | 3,426,680 |
| 50% | 49.9% | 2,854,195 | 2,850,615 |
| 40% | 40.0% | 2,283,356 | 2,282,641 |
| 30% | 30.0% | 1,712,517 | 1,711,284 |
| 20% | 20.0% | 1,141,678 | 1,143,086 |
| 10% | 9.9% | 570,839 | 567,892 |
| Active Idle | 0 | 0 | |
| Set Identifier: | sut |
| Set Description: | System Under Test |
| # of Identical Nodes: | 16 |
| Comment: | SUT |
| Hardware | |
|---|---|
| Hardware Vendor: | New H3C Technologies Co., Ltd. |
| Model: | H3C UniServer B5700 G3 |
| Form Factor: | other |
| CPU Name: | Intel Xeon Platinum 8180 2.50GHz |
| CPU Characteristics: | 28-Core, 2.50 GHz, 38.5 MB L3 Cache |
| CPU Frequency (MHz): | 2500 |
| CPU(s) Enabled: | 56 cores, 2 chips, 28 cores/chip |
| Hardware Threads: | 112 (2 / core) |
| CPU(s) Orderable: | 1,2 chips |
| Primary Cache: | 32 KB I + 32 KB D on chip per core |
| Secondary Cache: | 1 MB I+D on chip per core |
| Tertiary Cache: | 39424 KB I+D on chip per chip |
| Other Cache: | None |
| Memory Amount (GB): | 192.0 |
| # and size of DIMM: | 12 x 16384 MB |
| Memory Details: | 12 x 16GB 2Rx8 PC4-2666-V ECC;slots A1, A2, A3, A4, A5, A6, B1, B2, B3, B4, B5, B6 populated |
| Power Supply Quantity and Rating (W): | None |
| Power Supply Details: | Shared |
| Disk Drive: | SATA DOM 128GB P/N DESSH-A28D09BCADCA |
| Disk Controller: | Integrated SATA controller |
| # and type of Network Interface Cards (NICs) Installed: | 1 x Intel I350 Gigabit Ethernet Controller |
| NICs Enabled in Firmware / OS / Connected: | 2/2/1 |
| Network Speed (Mbit): | 1000 |
| Keyboard: | None |
| Mouse: | None |
| Monitor: | None |
| Optical Drives: | No |
| Other Hardware: | None |
| Software | |
|---|---|
| Power Management: | Balanced Mode enabled in OS (see SUT Notes) |
| Operating System (OS): | Microsoft Windows Server 2012 R2 Datacenter |
| OS Version: | Version 6.3 (Build 9600) |
| Filesystem: | NTFS |
| JVM Vendor: | Oracle Corporation |
| JVM Version: | Java HotSpot(TM) 64-Bit Server VM (build 24.80-b11, mixed mode), version 1.7.0_80 |
| JVM Command-line Options: | -server -Xmn19g -Xms21g -Xmx21g -XX:SurvivorRatio=1 -XX:TargetSurvivorRatio=99 -XX:ParallelGCThreads=28 -XX:AllocatePrefetchDistance=256 -XX:AllocatePrefetchLines=4 -XX:LoopUnrollLimit=45 -XX:InitialTenuringThreshold=12 -XX:MaxTenuringThreshold=15 -XX:InlineSmallCode=9000 -XX:MaxInlineSize=270 -XX:FreqInlineSize=6000 -XX:+UseLargePages -XX:+UseParallelOldGC -XX:+AggressiveOpts |
| JVM Affinity: | start /NODE [0,2] /AFFINITY [0xFC0FF00FC0FF];start /NODE [1,3] /AFFINITY [0xFF03F00FF03F] |
| JVM Instances: | 4 |
| JVM Initial Heap (MB): | 21000 |
| JVM Maximum Heap (MB): | 21000 |
| JVM Address Bits: | 64 |
| Boot Firmware Version: | 2.00.25 |
| Management Firmware Version: | UIS-OM 1.00.10 |
| Workload Version: | SSJ 1.2.10 |
| Director Location: | Controller |
| Other Software: | Microsoft Windows KB3021910, clearcompressionflag.exe, KB2919355, KB2932046, KB2959977, KB2937592, KB2938439, KB2934018, KB4056898, patched to this test system in May 16, 2019 |
| JVM Instance | ssj_ops@100% |
|---|---|
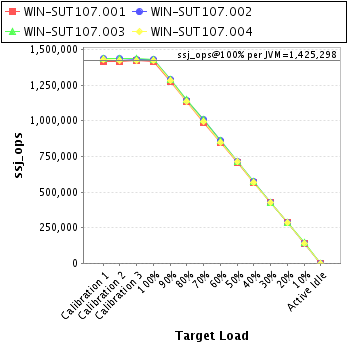
| WIN-SUT107.001 | 1,417,070 |
| WIN-SUT107.002 | 1,431,209 |
| WIN-SUT107.003 | 1,432,548 |
| WIN-SUT107.004 | 1,420,364 |
| ssj_ops@100% | 5,701,192 |
| ssj_ops@100% per JVM | 1,425,298 |
| Target Load | Actual Load | ssj_ops | |
|---|---|---|---|
| Target | Actual | ||
| Calibration 1 | 1,417,748 | ||
| Calibration 2 | 1,416,431 | ||
| Calibration 3 | 1,421,025 | ||
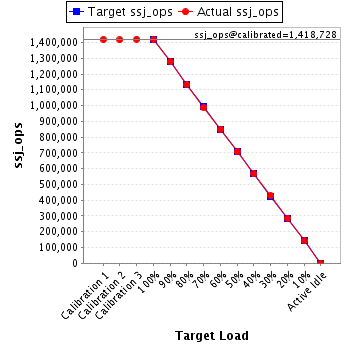
| ssj_ops@calibrated=1,418,728 | |||
| 100% | 99.9% | 1,418,728 | 1,417,070 |
| 90% | 90.0% | 1,276,855 | 1,277,561 |
| 80% | 79.9% | 1,134,982 | 1,133,473 |
| 70% | 69.7% | 993,109 | 989,330 |
| 60% | 60.0% | 851,237 | 851,010 |
| 50% | 49.9% | 709,364 | 707,288 |
| 40% | 40.0% | 567,491 | 567,660 |
| 30% | 30.1% | 425,618 | 427,000 |
| 20% | 20.0% | 283,746 | 283,963 |
| 10% | 10.0% | 141,873 | 141,840 |
| Active Idle | 0 | 0 | |
| Target Load | Actual Load | ssj_ops | |
|---|---|---|---|
| Target | Actual | ||
| Calibration 1 | 1,433,565 | ||
| Calibration 2 | 1,433,767 | ||
| Calibration 3 | 1,431,064 | ||
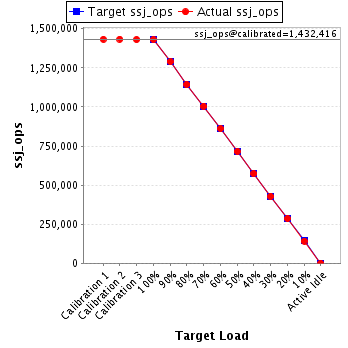
| ssj_ops@calibrated=1,432,416 | |||
| 100% | 99.9% | 1,432,416 | 1,431,209 |
| 90% | 90.0% | 1,289,174 | 1,289,717 |
| 80% | 79.9% | 1,145,933 | 1,143,963 |
| 70% | 70.2% | 1,002,691 | 1,005,895 |
| 60% | 60.1% | 859,450 | 861,173 |
| 50% | 50.0% | 716,208 | 715,646 |
| 40% | 40.0% | 572,966 | 572,695 |
| 30% | 29.9% | 429,725 | 428,446 |
| 20% | 20.0% | 286,483 | 285,941 |
| 10% | 9.9% | 143,242 | 142,022 |
| Active Idle | 0 | 0 | |
| Target Load | Actual Load | ssj_ops | |
|---|---|---|---|
| Target | Actual | ||
| Calibration 1 | 1,439,292 | ||
| Calibration 2 | 1,436,600 | ||
| Calibration 3 | 1,435,088 | ||
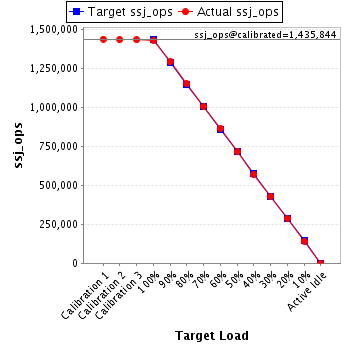
| ssj_ops@calibrated=1,435,844 | |||
| 100% | 99.8% | 1,435,844 | 1,432,548 |
| 90% | 90.0% | 1,292,260 | 1,292,823 |
| 80% | 80.2% | 1,148,675 | 1,151,810 |
| 70% | 70.2% | 1,005,091 | 1,007,543 |
| 60% | 60.2% | 861,506 | 863,667 |
| 50% | 49.9% | 717,922 | 716,435 |
| 40% | 39.9% | 574,338 | 573,226 |
| 30% | 29.9% | 430,753 | 428,884 |
| 20% | 20.1% | 287,169 | 289,134 |
| 10% | 9.9% | 143,584 | 142,543 |
| Active Idle | 0 | 0 | |
| Target Load | Actual Load | ssj_ops | |
|---|---|---|---|
| Target | Actual | ||
| Calibration 1 | 1,427,069 | ||
| Calibration 2 | 1,421,395 | ||
| Calibration 3 | 1,421,410 | ||
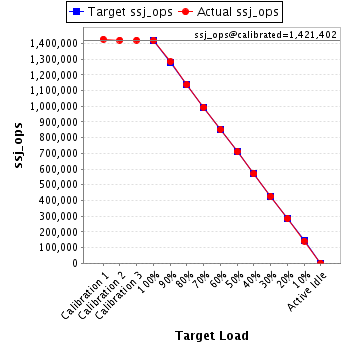
| ssj_ops@calibrated=1,421,402 | |||
| 100% | 99.9% | 1,421,402 | 1,420,364 |
| 90% | 90.3% | 1,279,262 | 1,283,347 |
| 80% | 80.0% | 1,137,122 | 1,137,202 |
| 70% | 69.9% | 994,982 | 993,361 |
| 60% | 59.9% | 852,841 | 850,830 |
| 50% | 50.0% | 710,701 | 711,246 |
| 40% | 40.0% | 568,561 | 569,059 |
| 30% | 30.0% | 426,421 | 426,954 |
| 20% | 20.0% | 284,280 | 284,049 |
| 10% | 10.0% | 142,140 | 141,488 |
| Active Idle | 0 | 0 | |