SPECpower_ssj2008
Host 'WIN-SUT106' Performance Report
Copyright © 2007-2019 Standard Performance Evaluation Corporation
| New H3C Technologies Co., Ltd. H3C UniServer B5700 G3 | ssj_ops@100% = 5,705,997 ssj_ops@100% per JVM = 1,426,499 |
||||
| Test Sponsor: | New H3C Technologies Co., Ltd. | SPEC License #: | 9066 | Test Method: | Multi Node |
| Tested By: | New H3C Technologies Co., Ltd. | Test Location: | Hangzhou, Zhejiang, China | Test Date: | May 24, 2019 |
| Hardware Availability: | Jan-2019 | Software Availability: | Jan-2019 | Publication: | Jun 26, 2019 |
| System Source: | Single Supplier | System Designation: | Server | Power Provisioning: | Line-powered |
| Target Load | Actual Load | ssj_ops | |
|---|---|---|---|
| Target | Actual | ||
| Calibration 1 | 5,718,820 | ||
| Calibration 2 | 5,714,144 | ||
| Calibration 3 | 5,725,044 | ||
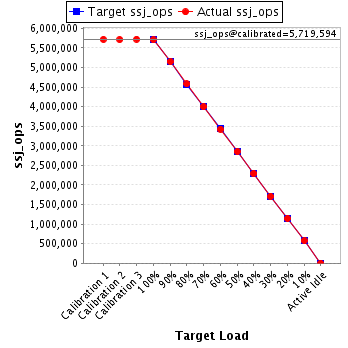
| ssj_ops@calibrated=5,719,594 | |||
| 100% | 99.8% | 5,719,594 | 5,705,997 |
| 90% | 90.0% | 5,147,635 | 5,150,032 |
| 80% | 80.1% | 4,575,675 | 4,582,477 |
| 70% | 69.9% | 4,003,716 | 3,998,896 |
| 60% | 59.9% | 3,431,756 | 3,427,784 |
| 50% | 49.9% | 2,859,797 | 2,853,426 |
| 40% | 40.0% | 2,287,838 | 2,289,684 |
| 30% | 29.9% | 1,715,878 | 1,711,157 |
| 20% | 20.0% | 1,143,919 | 1,143,293 |
| 10% | 10.1% | 571,959 | 575,030 |
| Active Idle | 0 | 0 | |
| Set Identifier: | sut |
| Set Description: | System Under Test |
| # of Identical Nodes: | 16 |
| Comment: | SUT |
| Hardware | |
|---|---|
| Hardware Vendor: | New H3C Technologies Co., Ltd. |
| Model: | H3C UniServer B5700 G3 |
| Form Factor: | other |
| CPU Name: | Intel Xeon Platinum 8180 2.50GHz |
| CPU Characteristics: | 28-Core, 2.50 GHz, 38.5 MB L3 Cache |
| CPU Frequency (MHz): | 2500 |
| CPU(s) Enabled: | 56 cores, 2 chips, 28 cores/chip |
| Hardware Threads: | 112 (2 / core) |
| CPU(s) Orderable: | 1,2 chips |
| Primary Cache: | 32 KB I + 32 KB D on chip per core |
| Secondary Cache: | 1 MB I+D on chip per core |
| Tertiary Cache: | 39424 KB I+D on chip per chip |
| Other Cache: | None |
| Memory Amount (GB): | 192.0 |
| # and size of DIMM: | 12 x 16384 MB |
| Memory Details: | 12 x 16GB 2Rx8 PC4-2666-V ECC;slots A1, A2, A3, A4, A5, A6, B1, B2, B3, B4, B5, B6 populated |
| Power Supply Quantity and Rating (W): | None |
| Power Supply Details: | Shared |
| Disk Drive: | SATA DOM 128GB P/N DESSH-A28D09BCADCA |
| Disk Controller: | Integrated SATA controller |
| # and type of Network Interface Cards (NICs) Installed: | 1 x Intel I350 Gigabit Ethernet Controller |
| NICs Enabled in Firmware / OS / Connected: | 2/2/1 |
| Network Speed (Mbit): | 1000 |
| Keyboard: | None |
| Mouse: | None |
| Monitor: | None |
| Optical Drives: | No |
| Other Hardware: | None |
| Software | |
|---|---|
| Power Management: | Balanced Mode enabled in OS (see SUT Notes) |
| Operating System (OS): | Microsoft Windows Server 2012 R2 Datacenter |
| OS Version: | Version 6.3 (Build 9600) |
| Filesystem: | NTFS |
| JVM Vendor: | Oracle Corporation |
| JVM Version: | Java HotSpot(TM) 64-Bit Server VM (build 24.80-b11, mixed mode), version 1.7.0_80 |
| JVM Command-line Options: | -server -Xmn19g -Xms21g -Xmx21g -XX:SurvivorRatio=1 -XX:TargetSurvivorRatio=99 -XX:ParallelGCThreads=28 -XX:AllocatePrefetchDistance=256 -XX:AllocatePrefetchLines=4 -XX:LoopUnrollLimit=45 -XX:InitialTenuringThreshold=12 -XX:MaxTenuringThreshold=15 -XX:InlineSmallCode=9000 -XX:MaxInlineSize=270 -XX:FreqInlineSize=6000 -XX:+UseLargePages -XX:+UseParallelOldGC -XX:+AggressiveOpts |
| JVM Affinity: | start /NODE [0,2] /AFFINITY [0xFC0FF00FC0FF];start /NODE [1,3] /AFFINITY [0xFF03F00FF03F] |
| JVM Instances: | 4 |
| JVM Initial Heap (MB): | 21000 |
| JVM Maximum Heap (MB): | 21000 |
| JVM Address Bits: | 64 |
| Boot Firmware Version: | 2.00.25 |
| Management Firmware Version: | UIS-OM 1.00.10 |
| Workload Version: | SSJ 1.2.10 |
| Director Location: | Controller |
| Other Software: | Microsoft Windows KB3021910, clearcompressionflag.exe, KB2919355, KB2932046, KB2959977, KB2937592, KB2938439, KB2934018, KB4056898, patched to this test system in May 16, 2019 |
| JVM Instance | ssj_ops@100% |
|---|---|
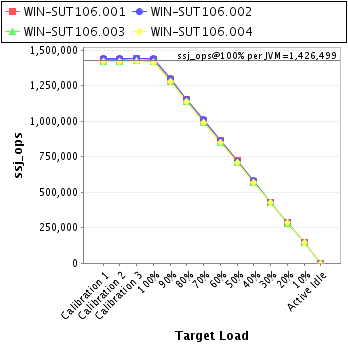
| WIN-SUT106.001 | 1,433,556 |
| WIN-SUT106.002 | 1,437,993 |
| WIN-SUT106.003 | 1,418,976 |
| WIN-SUT106.004 | 1,415,472 |
| ssj_ops@100% | 5,705,997 |
| ssj_ops@100% per JVM | 1,426,499 |
| Target Load | Actual Load | ssj_ops | |
|---|---|---|---|
| Target | Actual | ||
| Calibration 1 | 1,436,353 | ||
| Calibration 2 | 1,435,337 | ||
| Calibration 3 | 1,441,090 | ||
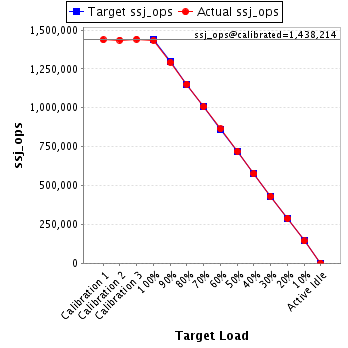
| ssj_ops@calibrated=1,438,214 | |||
| 100% | 99.7% | 1,438,214 | 1,433,556 |
| 90% | 89.8% | 1,294,392 | 1,292,116 |
| 80% | 80.1% | 1,150,571 | 1,151,570 |
| 70% | 70.0% | 1,006,749 | 1,006,423 |
| 60% | 60.1% | 862,928 | 863,702 |
| 50% | 50.1% | 719,107 | 719,886 |
| 40% | 40.0% | 575,285 | 575,020 |
| 30% | 30.0% | 431,464 | 430,975 |
| 20% | 20.0% | 287,643 | 288,352 |
| 10% | 10.0% | 143,821 | 143,270 |
| Active Idle | 0 | 0 | |
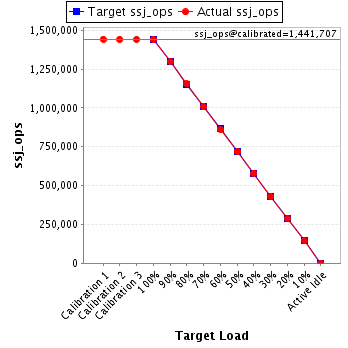
| Target Load | Actual Load | ssj_ops | |
|---|---|---|---|
| Target | Actual | ||
| Calibration 1 | 1,442,934 | ||
| Calibration 2 | 1,441,917 | ||
| Calibration 3 | 1,441,498 | ||
| ssj_ops@calibrated=1,441,707 | |||
| 100% | 99.7% | 1,441,707 | 1,437,993 |
| 90% | 90.0% | 1,297,537 | 1,297,574 |
| 80% | 80.1% | 1,153,366 | 1,155,401 |
| 70% | 70.0% | 1,009,195 | 1,008,567 |
| 60% | 59.9% | 865,024 | 862,961 |
| 50% | 49.9% | 720,854 | 719,451 |
| 40% | 40.2% | 576,683 | 579,008 |
| 30% | 29.9% | 432,512 | 430,660 |
| 20% | 20.0% | 288,341 | 288,383 |
| 10% | 10.0% | 144,171 | 144,891 |
| Active Idle | 0 | 0 | |
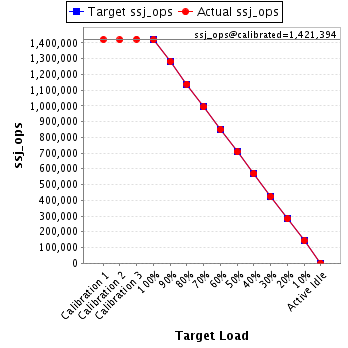
| Target Load | Actual Load | ssj_ops | |
|---|---|---|---|
| Target | Actual | ||
| Calibration 1 | 1,420,825 | ||
| Calibration 2 | 1,419,191 | ||
| Calibration 3 | 1,423,598 | ||
| ssj_ops@calibrated=1,421,394 | |||
| 100% | 99.8% | 1,421,394 | 1,418,976 |
| 90% | 90.2% | 1,279,255 | 1,282,056 |
| 80% | 80.1% | 1,137,116 | 1,138,239 |
| 70% | 69.8% | 994,976 | 992,723 |
| 60% | 59.9% | 852,837 | 851,455 |
| 50% | 49.8% | 710,697 | 707,991 |
| 40% | 40.0% | 568,558 | 569,262 |
| 30% | 29.8% | 426,418 | 424,044 |
| 20% | 19.9% | 284,279 | 282,359 |
| 10% | 10.1% | 142,139 | 143,576 |
| Active Idle | 0 | 0 | |
| Target Load | Actual Load | ssj_ops | |
|---|---|---|---|
| Target | Actual | ||
| Calibration 1 | 1,418,707 | ||
| Calibration 2 | 1,417,699 | ||
| Calibration 3 | 1,418,859 | ||
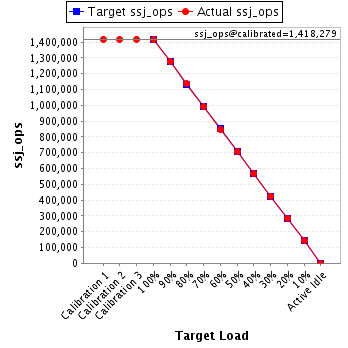
| ssj_ops@calibrated=1,418,279 | |||
| 100% | 99.8% | 1,418,279 | 1,415,472 |
| 90% | 90.1% | 1,276,451 | 1,278,287 |
| 80% | 80.2% | 1,134,623 | 1,137,267 |
| 70% | 69.9% | 992,795 | 991,183 |
| 60% | 59.9% | 850,967 | 849,666 |
| 50% | 49.8% | 709,139 | 706,099 |
| 40% | 39.9% | 567,312 | 566,395 |
| 30% | 30.0% | 425,484 | 425,477 |
| 20% | 20.0% | 283,656 | 284,200 |
| 10% | 10.1% | 141,828 | 143,292 |
| Active Idle | 0 | 0 | |