SPECpower_ssj2008
Host 'WIN-SUT105' Performance Report
Copyright © 2007-2019 Standard Performance Evaluation Corporation
| New H3C Technologies Co., Ltd. H3C UniServer B5700 G3 | ssj_ops@100% = 5,671,792 ssj_ops@100% per JVM = 1,417,948 |
||||
| Test Sponsor: | New H3C Technologies Co., Ltd. | SPEC License #: | 9066 | Test Method: | Multi Node |
| Tested By: | New H3C Technologies Co., Ltd. | Test Location: | Hangzhou, Zhejiang, China | Test Date: | May 24, 2019 |
| Hardware Availability: | Jan-2019 | Software Availability: | Jan-2019 | Publication: | Jun 26, 2019 |
| System Source: | Single Supplier | System Designation: | Server | Power Provisioning: | Line-powered |
| Target Load | Actual Load | ssj_ops | |
|---|---|---|---|
| Target | Actual | ||
| Calibration 1 | 5,680,882 | ||
| Calibration 2 | 5,675,874 | ||
| Calibration 3 | 5,685,920 | ||
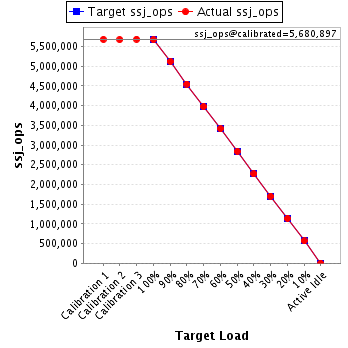
| ssj_ops@calibrated=5,680,897 | |||
| 100% | 99.8% | 5,680,897 | 5,671,792 |
| 90% | 90.1% | 5,112,808 | 5,120,352 |
| 80% | 80.1% | 4,544,718 | 4,547,807 |
| 70% | 70.0% | 3,976,628 | 3,976,151 |
| 60% | 60.0% | 3,408,538 | 3,410,698 |
| 50% | 50.0% | 2,840,449 | 2,842,325 |
| 40% | 39.9% | 2,272,359 | 2,265,390 |
| 30% | 30.0% | 1,704,269 | 1,702,137 |
| 20% | 20.1% | 1,136,179 | 1,139,232 |
| 10% | 10.0% | 568,090 | 566,346 |
| Active Idle | 0 | 0 | |
| Set Identifier: | sut |
| Set Description: | System Under Test |
| # of Identical Nodes: | 16 |
| Comment: | SUT |
| Hardware | |
|---|---|
| Hardware Vendor: | New H3C Technologies Co., Ltd. |
| Model: | H3C UniServer B5700 G3 |
| Form Factor: | other |
| CPU Name: | Intel Xeon Platinum 8180 2.50GHz |
| CPU Characteristics: | 28-Core, 2.50 GHz, 38.5 MB L3 Cache |
| CPU Frequency (MHz): | 2500 |
| CPU(s) Enabled: | 56 cores, 2 chips, 28 cores/chip |
| Hardware Threads: | 112 (2 / core) |
| CPU(s) Orderable: | 1,2 chips |
| Primary Cache: | 32 KB I + 32 KB D on chip per core |
| Secondary Cache: | 1 MB I+D on chip per core |
| Tertiary Cache: | 39424 KB I+D on chip per chip |
| Other Cache: | None |
| Memory Amount (GB): | 192.0 |
| # and size of DIMM: | 12 x 16384 MB |
| Memory Details: | 12 x 16GB 2Rx8 PC4-2666-V ECC;slots A1, A2, A3, A4, A5, A6, B1, B2, B3, B4, B5, B6 populated |
| Power Supply Quantity and Rating (W): | None |
| Power Supply Details: | Shared |
| Disk Drive: | SATA DOM 128GB P/N DESSH-A28D09BCADCA |
| Disk Controller: | Integrated SATA controller |
| # and type of Network Interface Cards (NICs) Installed: | 1 x Intel I350 Gigabit Ethernet Controller |
| NICs Enabled in Firmware / OS / Connected: | 2/2/1 |
| Network Speed (Mbit): | 1000 |
| Keyboard: | None |
| Mouse: | None |
| Monitor: | None |
| Optical Drives: | No |
| Other Hardware: | None |
| Software | |
|---|---|
| Power Management: | Balanced Mode enabled in OS (see SUT Notes) |
| Operating System (OS): | Microsoft Windows Server 2012 R2 Datacenter |
| OS Version: | Version 6.3 (Build 9600) |
| Filesystem: | NTFS |
| JVM Vendor: | Oracle Corporation |
| JVM Version: | Java HotSpot(TM) 64-Bit Server VM (build 24.80-b11, mixed mode), version 1.7.0_80 |
| JVM Command-line Options: | -server -Xmn19g -Xms21g -Xmx21g -XX:SurvivorRatio=1 -XX:TargetSurvivorRatio=99 -XX:ParallelGCThreads=28 -XX:AllocatePrefetchDistance=256 -XX:AllocatePrefetchLines=4 -XX:LoopUnrollLimit=45 -XX:InitialTenuringThreshold=12 -XX:MaxTenuringThreshold=15 -XX:InlineSmallCode=9000 -XX:MaxInlineSize=270 -XX:FreqInlineSize=6000 -XX:+UseLargePages -XX:+UseParallelOldGC -XX:+AggressiveOpts |
| JVM Affinity: | start /NODE [0,2] /AFFINITY [0xFC0FF00FC0FF];start /NODE [1,3] /AFFINITY [0xFF03F00FF03F] |
| JVM Instances: | 4 |
| JVM Initial Heap (MB): | 21000 |
| JVM Maximum Heap (MB): | 21000 |
| JVM Address Bits: | 64 |
| Boot Firmware Version: | 2.00.25 |
| Management Firmware Version: | UIS-OM 1.00.10 |
| Workload Version: | SSJ 1.2.10 |
| Director Location: | Controller |
| Other Software: | Microsoft Windows KB3021910, clearcompressionflag.exe, KB2919355, KB2932046, KB2959977, KB2937592, KB2938439, KB2934018, KB4056898, patched to this test system in May 16, 2019 |
| JVM Instance | ssj_ops@100% |
|---|---|
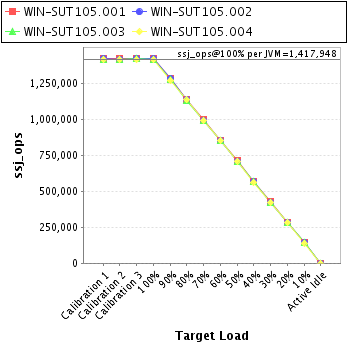
| WIN-SUT105.001 | 1,423,005 |
| WIN-SUT105.002 | 1,421,234 |
| WIN-SUT105.003 | 1,413,664 |
| WIN-SUT105.004 | 1,413,889 |
| ssj_ops@100% | 5,671,792 |
| ssj_ops@100% per JVM | 1,417,948 |
| Target Load | Actual Load | ssj_ops | |
|---|---|---|---|
| Target | Actual | ||
| Calibration 1 | 1,425,219 | ||
| Calibration 2 | 1,424,556 | ||
| Calibration 3 | 1,424,678 | ||
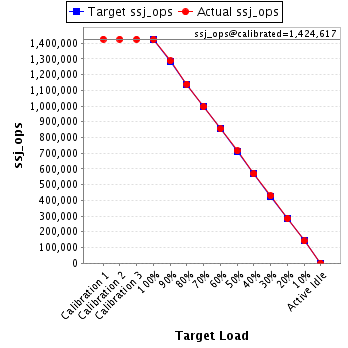
| ssj_ops@calibrated=1,424,617 | |||
| 100% | 99.9% | 1,424,617 | 1,423,005 |
| 90% | 90.3% | 1,282,155 | 1,286,762 |
| 80% | 80.0% | 1,139,694 | 1,139,018 |
| 70% | 69.9% | 997,232 | 996,071 |
| 60% | 60.0% | 854,770 | 854,702 |
| 50% | 50.1% | 712,309 | 714,138 |
| 40% | 39.9% | 569,847 | 568,784 |
| 30% | 30.1% | 427,385 | 428,163 |
| 20% | 20.0% | 284,923 | 285,050 |
| 10% | 10.0% | 142,462 | 141,923 |
| Active Idle | 0 | 0 | |
| Target Load | Actual Load | ssj_ops | |
|---|---|---|---|
| Target | Actual | ||
| Calibration 1 | 1,421,902 | ||
| Calibration 2 | 1,419,325 | ||
| Calibration 3 | 1,423,774 | ||
| ssj_ops@calibrated=1,421,550 | |||
| 100% | 100.0% | 1,421,550 | 1,421,234 |
| 90% | 90.2% | 1,279,395 | 1,282,514 |
| 80% | 80.2% | 1,137,240 | 1,139,946 |
| 70% | 69.9% | 995,085 | 994,242 |
| 60% | 59.9% | 852,930 | 851,636 |
| 50% | 50.0% | 710,775 | 710,411 |
| 40% | 39.9% | 568,620 | 566,563 |
| 30% | 29.9% | 426,465 | 424,724 |
| 20% | 20.1% | 284,310 | 285,375 |
| 10% | 10.0% | 142,155 | 142,283 |
| Active Idle | 0 | 0 | |

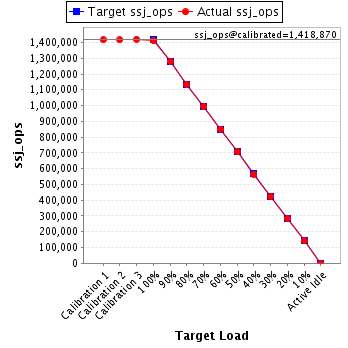
| Target Load | Actual Load | ssj_ops | |
|---|---|---|---|
| Target | Actual | ||
| Calibration 1 | 1,416,298 | ||
| Calibration 2 | 1,416,728 | ||
| Calibration 3 | 1,421,011 | ||
| ssj_ops@calibrated=1,418,870 | |||
| 100% | 99.6% | 1,418,870 | 1,413,664 |
| 90% | 90.2% | 1,276,983 | 1,279,261 |
| 80% | 79.9% | 1,135,096 | 1,134,216 |
| 70% | 70.0% | 993,209 | 992,744 |
| 60% | 60.0% | 851,322 | 851,248 |
| 50% | 49.9% | 709,435 | 707,357 |
| 40% | 39.9% | 567,548 | 565,818 |
| 30% | 30.0% | 425,661 | 425,038 |
| 20% | 20.1% | 283,774 | 284,803 |
| 10% | 10.0% | 141,887 | 141,569 |
| Active Idle | 0 | 0 | |
| Target Load | Actual Load | ssj_ops | |
|---|---|---|---|
| Target | Actual | ||
| Calibration 1 | 1,417,463 | ||
| Calibration 2 | 1,415,265 | ||
| Calibration 3 | 1,416,457 | ||
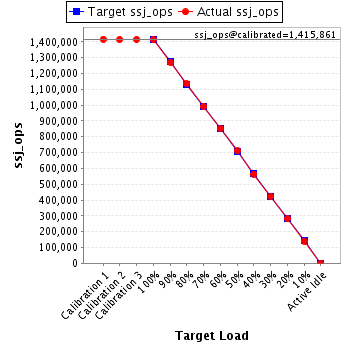
| ssj_ops@calibrated=1,415,861 | |||
| 100% | 99.9% | 1,415,861 | 1,413,889 |
| 90% | 89.8% | 1,274,275 | 1,271,815 |
| 80% | 80.1% | 1,132,689 | 1,134,627 |
| 70% | 70.1% | 991,103 | 993,093 |
| 60% | 60.3% | 849,517 | 853,113 |
| 50% | 50.2% | 707,930 | 710,419 |
| 40% | 39.9% | 566,344 | 564,225 |
| 30% | 30.0% | 424,758 | 424,211 |
| 20% | 20.1% | 283,172 | 284,004 |
| 10% | 9.9% | 141,586 | 140,571 |
| Active Idle | 0 | 0 | |