SPECpower_ssj2008
Host 'WIN-SUT104' Performance Report
Copyright © 2007-2019 Standard Performance Evaluation Corporation
| New H3C Technologies Co., Ltd. H3C UniServer B5700 G3 | ssj_ops@100% = 5,697,549 ssj_ops@100% per JVM = 1,424,387 |
||||
| Test Sponsor: | New H3C Technologies Co., Ltd. | SPEC License #: | 9066 | Test Method: | Multi Node |
| Tested By: | New H3C Technologies Co., Ltd. | Test Location: | Hangzhou, Zhejiang, China | Test Date: | May 24, 2019 |
| Hardware Availability: | Jan-2019 | Software Availability: | Jan-2019 | Publication: | Jun 26, 2019 |
| System Source: | Single Supplier | System Designation: | Server | Power Provisioning: | Line-powered |
| Target Load | Actual Load | ssj_ops | |
|---|---|---|---|
| Target | Actual | ||
| Calibration 1 | 5,704,286 | ||
| Calibration 2 | 5,704,094 | ||
| Calibration 3 | 5,717,703 | ||
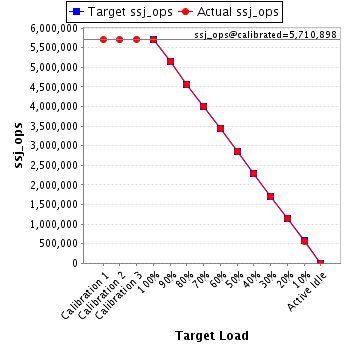
| ssj_ops@calibrated=5,710,898 | |||
| 100% | 99.8% | 5,710,898 | 5,697,549 |
| 90% | 90.0% | 5,139,809 | 5,140,209 |
| 80% | 79.9% | 4,568,719 | 4,565,530 |
| 70% | 70.1% | 3,997,629 | 4,006,124 |
| 60% | 60.1% | 3,426,539 | 3,433,944 |
| 50% | 50.1% | 2,855,449 | 2,859,292 |
| 40% | 40.0% | 2,284,359 | 2,283,787 |
| 30% | 30.0% | 1,713,270 | 1,711,427 |
| 20% | 20.0% | 1,142,180 | 1,142,803 |
| 10% | 9.9% | 571,090 | 567,615 |
| Active Idle | 0 | 0 | |
| Set Identifier: | sut |
| Set Description: | System Under Test |
| # of Identical Nodes: | 16 |
| Comment: | SUT |
| Hardware | |
|---|---|
| Hardware Vendor: | New H3C Technologies Co., Ltd. |
| Model: | H3C UniServer B5700 G3 |
| Form Factor: | other |
| CPU Name: | Intel Xeon Platinum 8180 2.50GHz |
| CPU Characteristics: | 28-Core, 2.50 GHz, 38.5 MB L3 Cache |
| CPU Frequency (MHz): | 2500 |
| CPU(s) Enabled: | 56 cores, 2 chips, 28 cores/chip |
| Hardware Threads: | 112 (2 / core) |
| CPU(s) Orderable: | 1,2 chips |
| Primary Cache: | 32 KB I + 32 KB D on chip per core |
| Secondary Cache: | 1 MB I+D on chip per core |
| Tertiary Cache: | 39424 KB I+D on chip per chip |
| Other Cache: | None |
| Memory Amount (GB): | 192.0 |
| # and size of DIMM: | 12 x 16384 MB |
| Memory Details: | 12 x 16GB 2Rx8 PC4-2666-V ECC;slots A1, A2, A3, A4, A5, A6, B1, B2, B3, B4, B5, B6 populated |
| Power Supply Quantity and Rating (W): | None |
| Power Supply Details: | Shared |
| Disk Drive: | SATA DOM 128GB P/N DESSH-A28D09BCADCA |
| Disk Controller: | Integrated SATA controller |
| # and type of Network Interface Cards (NICs) Installed: | 1 x Intel I350 Gigabit Ethernet Controller |
| NICs Enabled in Firmware / OS / Connected: | 2/2/1 |
| Network Speed (Mbit): | 1000 |
| Keyboard: | None |
| Mouse: | None |
| Monitor: | None |
| Optical Drives: | No |
| Other Hardware: | None |
| Software | |
|---|---|
| Power Management: | Balanced Mode enabled in OS (see SUT Notes) |
| Operating System (OS): | Microsoft Windows Server 2012 R2 Datacenter |
| OS Version: | Version 6.3 (Build 9600) |
| Filesystem: | NTFS |
| JVM Vendor: | Oracle Corporation |
| JVM Version: | Java HotSpot(TM) 64-Bit Server VM (build 24.80-b11, mixed mode), version 1.7.0_80 |
| JVM Command-line Options: | -server -Xmn19g -Xms21g -Xmx21g -XX:SurvivorRatio=1 -XX:TargetSurvivorRatio=99 -XX:ParallelGCThreads=28 -XX:AllocatePrefetchDistance=256 -XX:AllocatePrefetchLines=4 -XX:LoopUnrollLimit=45 -XX:InitialTenuringThreshold=12 -XX:MaxTenuringThreshold=15 -XX:InlineSmallCode=9000 -XX:MaxInlineSize=270 -XX:FreqInlineSize=6000 -XX:+UseLargePages -XX:+UseParallelOldGC -XX:+AggressiveOpts |
| JVM Affinity: | start /NODE [0,2] /AFFINITY [0xFC0FF00FC0FF];start /NODE [1,3] /AFFINITY [0xFF03F00FF03F] |
| JVM Instances: | 4 |
| JVM Initial Heap (MB): | 21000 |
| JVM Maximum Heap (MB): | 21000 |
| JVM Address Bits: | 64 |
| Boot Firmware Version: | 2.00.25 |
| Management Firmware Version: | UIS-OM 1.00.10 |
| Workload Version: | SSJ 1.2.10 |
| Director Location: | Controller |
| Other Software: | Microsoft Windows KB3021910, clearcompressionflag.exe, KB2919355, KB2932046, KB2959977, KB2937592, KB2938439, KB2934018, KB4056898, patched to this test system in May 16, 2019 |
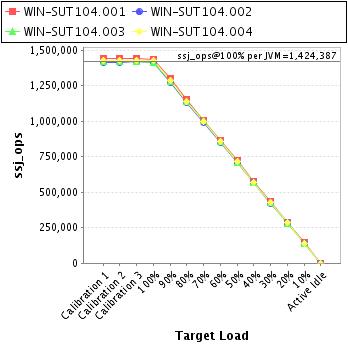
| JVM Instance | ssj_ops@100% |
|---|---|
| WIN-SUT104.001 | 1,438,394 |
| WIN-SUT104.002 | 1,415,658 |
| WIN-SUT104.003 | 1,417,268 |
| WIN-SUT104.004 | 1,426,228 |
| ssj_ops@100% | 5,697,549 |
| ssj_ops@100% per JVM | 1,424,387 |
| Target Load | Actual Load | ssj_ops | |
|---|---|---|---|
| Target | Actual | ||
| Calibration 1 | 1,439,849 | ||
| Calibration 2 | 1,440,744 | ||
| Calibration 3 | 1,444,255 | ||
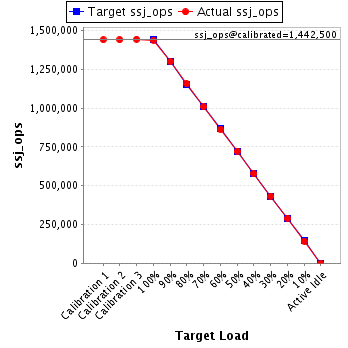
| ssj_ops@calibrated=1,442,500 | |||
| 100% | 99.7% | 1,442,500 | 1,438,394 |
| 90% | 90.2% | 1,298,250 | 1,300,952 |
| 80% | 80.1% | 1,154,000 | 1,155,977 |
| 70% | 69.9% | 1,009,750 | 1,008,873 |
| 60% | 59.9% | 865,500 | 864,735 |
| 50% | 50.1% | 721,250 | 722,355 |
| 40% | 40.0% | 577,000 | 577,228 |
| 30% | 30.0% | 432,750 | 433,163 |
| 20% | 20.0% | 288,500 | 289,005 |
| 10% | 9.9% | 144,250 | 143,267 |
| Active Idle | 0 | 0 | |
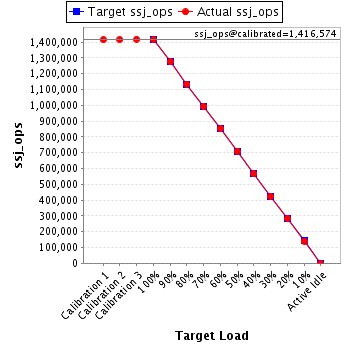
| Target Load | Actual Load | ssj_ops | |
|---|---|---|---|
| Target | Actual | ||
| Calibration 1 | 1,414,175 | ||
| Calibration 2 | 1,414,977 | ||
| Calibration 3 | 1,418,170 | ||
| ssj_ops@calibrated=1,416,574 | |||
| 100% | 99.9% | 1,416,574 | 1,415,658 |
| 90% | 90.0% | 1,274,916 | 1,275,469 |
| 80% | 80.1% | 1,133,259 | 1,134,277 |
| 70% | 70.1% | 991,602 | 993,224 |
| 60% | 60.2% | 849,944 | 853,183 |
| 50% | 50.1% | 708,287 | 710,029 |
| 40% | 39.9% | 566,629 | 565,577 |
| 30% | 29.8% | 424,972 | 422,702 |
| 20% | 20.1% | 283,315 | 284,248 |
| 10% | 9.9% | 141,657 | 140,789 |
| Active Idle | 0 | 0 | |
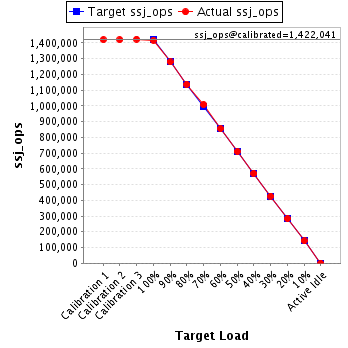
| Target Load | Actual Load | ssj_ops | |
|---|---|---|---|
| Target | Actual | ||
| Calibration 1 | 1,419,964 | ||
| Calibration 2 | 1,420,066 | ||
| Calibration 3 | 1,424,017 | ||
| ssj_ops@calibrated=1,422,041 | |||
| 100% | 99.7% | 1,422,041 | 1,417,268 |
| 90% | 89.9% | 1,279,837 | 1,278,994 |
| 80% | 79.9% | 1,137,633 | 1,136,561 |
| 70% | 70.9% | 995,429 | 1,007,723 |
| 60% | 60.1% | 853,225 | 855,192 |
| 50% | 50.0% | 711,021 | 710,399 |
| 40% | 40.1% | 568,817 | 570,000 |
| 30% | 30.1% | 426,612 | 427,369 |
| 20% | 19.9% | 284,408 | 283,248 |
| 10% | 10.0% | 142,204 | 142,154 |
| Active Idle | 0 | 0 | |
| Target Load | Actual Load | ssj_ops | |
|---|---|---|---|
| Target | Actual | ||
| Calibration 1 | 1,430,298 | ||
| Calibration 2 | 1,428,307 | ||
| Calibration 3 | 1,431,261 | ||
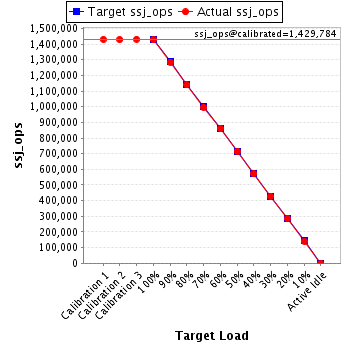
| ssj_ops@calibrated=1,429,784 | |||
| 100% | 99.8% | 1,429,784 | 1,426,228 |
| 90% | 89.9% | 1,286,805 | 1,284,794 |
| 80% | 79.6% | 1,143,827 | 1,138,715 |
| 70% | 69.7% | 1,000,849 | 996,304 |
| 60% | 60.2% | 857,870 | 860,834 |
| 50% | 50.1% | 714,892 | 716,510 |
| 40% | 39.9% | 571,914 | 570,982 |
| 30% | 29.9% | 428,935 | 428,193 |
| 20% | 20.0% | 285,957 | 286,302 |
| 10% | 9.9% | 142,978 | 141,404 |
| Active Idle | 0 | 0 | |