SPECpower_ssj2008
Host 'WIN-SUT103' Performance Report
Copyright © 2007-2019 Standard Performance Evaluation Corporation
| New H3C Technologies Co., Ltd. H3C UniServer B5700 G3 | ssj_ops@100% = 5,679,710 ssj_ops@100% per JVM = 1,419,927 |
||||
| Test Sponsor: | New H3C Technologies Co., Ltd. | SPEC License #: | 9066 | Test Method: | Multi Node |
| Tested By: | New H3C Technologies Co., Ltd. | Test Location: | Hangzhou, Zhejiang, China | Test Date: | May 24, 2019 |
| Hardware Availability: | Jan-2019 | Software Availability: | Jan-2019 | Publication: | Jun 26, 2019 |
| System Source: | Single Supplier | System Designation: | Server | Power Provisioning: | Line-powered |
| Target Load | Actual Load | ssj_ops | |
|---|---|---|---|
| Target | Actual | ||
| Calibration 1 | 5,698,970 | ||
| Calibration 2 | 5,683,903 | ||
| Calibration 3 | 5,694,553 | ||
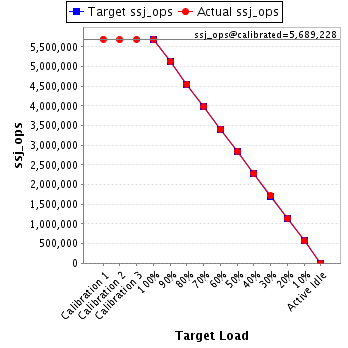
| ssj_ops@calibrated=5,689,228 | |||
| 100% | 99.8% | 5,689,228 | 5,679,710 |
| 90% | 90.2% | 5,120,305 | 5,129,887 |
| 80% | 80.1% | 4,551,383 | 4,555,204 |
| 70% | 70.1% | 3,982,460 | 3,985,503 |
| 60% | 60.0% | 3,413,537 | 3,413,530 |
| 50% | 50.1% | 2,844,614 | 2,847,728 |
| 40% | 40.1% | 2,275,691 | 2,279,407 |
| 30% | 30.1% | 1,706,768 | 1,711,387 |
| 20% | 20.0% | 1,137,846 | 1,139,285 |
| 10% | 10.0% | 568,923 | 568,850 |
| Active Idle | 0 | 0 | |
| Set Identifier: | sut |
| Set Description: | System Under Test |
| # of Identical Nodes: | 16 |
| Comment: | SUT |
| Hardware | |
|---|---|
| Hardware Vendor: | New H3C Technologies Co., Ltd. |
| Model: | H3C UniServer B5700 G3 |
| Form Factor: | other |
| CPU Name: | Intel Xeon Platinum 8180 2.50GHz |
| CPU Characteristics: | 28-Core, 2.50 GHz, 38.5 MB L3 Cache |
| CPU Frequency (MHz): | 2500 |
| CPU(s) Enabled: | 56 cores, 2 chips, 28 cores/chip |
| Hardware Threads: | 112 (2 / core) |
| CPU(s) Orderable: | 1,2 chips |
| Primary Cache: | 32 KB I + 32 KB D on chip per core |
| Secondary Cache: | 1 MB I+D on chip per core |
| Tertiary Cache: | 39424 KB I+D on chip per chip |
| Other Cache: | None |
| Memory Amount (GB): | 192.0 |
| # and size of DIMM: | 12 x 16384 MB |
| Memory Details: | 12 x 16GB 2Rx8 PC4-2666-V ECC;slots A1, A2, A3, A4, A5, A6, B1, B2, B3, B4, B5, B6 populated |
| Power Supply Quantity and Rating (W): | None |
| Power Supply Details: | Shared |
| Disk Drive: | SATA DOM 128GB P/N DESSH-A28D09BCADCA |
| Disk Controller: | Integrated SATA controller |
| # and type of Network Interface Cards (NICs) Installed: | 1 x Intel I350 Gigabit Ethernet Controller |
| NICs Enabled in Firmware / OS / Connected: | 2/2/1 |
| Network Speed (Mbit): | 1000 |
| Keyboard: | None |
| Mouse: | None |
| Monitor: | None |
| Optical Drives: | No |
| Other Hardware: | None |
| Software | |
|---|---|
| Power Management: | Balanced Mode enabled in OS (see SUT Notes) |
| Operating System (OS): | Microsoft Windows Server 2012 R2 Datacenter |
| OS Version: | Version 6.3 (Build 9600) |
| Filesystem: | NTFS |
| JVM Vendor: | Oracle Corporation |
| JVM Version: | Java HotSpot(TM) 64-Bit Server VM (build 24.80-b11, mixed mode), version 1.7.0_80 |
| JVM Command-line Options: | -server -Xmn19g -Xms21g -Xmx21g -XX:SurvivorRatio=1 -XX:TargetSurvivorRatio=99 -XX:ParallelGCThreads=28 -XX:AllocatePrefetchDistance=256 -XX:AllocatePrefetchLines=4 -XX:LoopUnrollLimit=45 -XX:InitialTenuringThreshold=12 -XX:MaxTenuringThreshold=15 -XX:InlineSmallCode=9000 -XX:MaxInlineSize=270 -XX:FreqInlineSize=6000 -XX:+UseLargePages -XX:+UseParallelOldGC -XX:+AggressiveOpts |
| JVM Affinity: | start /NODE [0,2] /AFFINITY [0xFC0FF00FC0FF];start /NODE [1,3] /AFFINITY [0xFF03F00FF03F] |
| JVM Instances: | 4 |
| JVM Initial Heap (MB): | 21000 |
| JVM Maximum Heap (MB): | 21000 |
| JVM Address Bits: | 64 |
| Boot Firmware Version: | 2.00.25 |
| Management Firmware Version: | UIS-OM 1.00.10 |
| Workload Version: | SSJ 1.2.10 |
| Director Location: | Controller |
| Other Software: | Microsoft Windows KB3021910, clearcompressionflag.exe, KB2919355, KB2932046, KB2959977, KB2937592, KB2938439, KB2934018, KB4056898, patched to this test system in May 16, 2019 |
| JVM Instance | ssj_ops@100% |
|---|---|
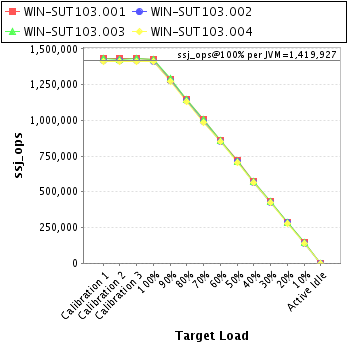
| WIN-SUT103.001 | 1,429,335 |
| WIN-SUT103.002 | 1,414,435 |
| WIN-SUT103.003 | 1,427,027 |
| WIN-SUT103.004 | 1,408,912 |
| ssj_ops@100% | 5,679,710 |
| ssj_ops@100% per JVM | 1,419,927 |
| Target Load | Actual Load | ssj_ops | |
|---|---|---|---|
| Target | Actual | ||
| Calibration 1 | 1,435,088 | ||
| Calibration 2 | 1,431,424 | ||
| Calibration 3 | 1,434,127 | ||
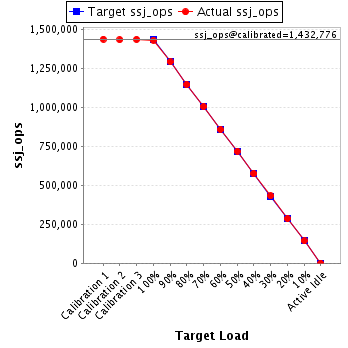
| ssj_ops@calibrated=1,432,776 | |||
| 100% | 99.8% | 1,432,776 | 1,429,335 |
| 90% | 90.0% | 1,289,498 | 1,289,275 |
| 80% | 79.9% | 1,146,220 | 1,144,924 |
| 70% | 70.1% | 1,002,943 | 1,004,040 |
| 60% | 59.8% | 859,665 | 856,270 |
| 50% | 50.1% | 716,388 | 717,465 |
| 40% | 40.0% | 573,110 | 573,810 |
| 30% | 30.1% | 429,833 | 430,911 |
| 20% | 19.9% | 286,555 | 284,768 |
| 10% | 10.0% | 143,278 | 143,357 |
| Active Idle | 0 | 0 | |
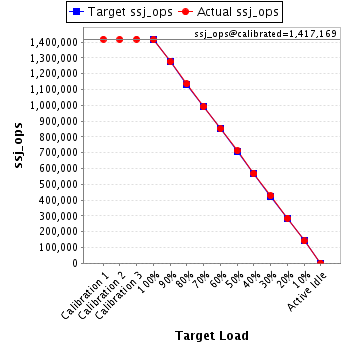
| Target Load | Actual Load | ssj_ops | |
|---|---|---|---|
| Target | Actual | ||
| Calibration 1 | 1,418,191 | ||
| Calibration 2 | 1,416,018 | ||
| Calibration 3 | 1,418,320 | ||
| ssj_ops@calibrated=1,417,169 | |||
| 100% | 99.8% | 1,417,169 | 1,414,435 |
| 90% | 90.0% | 1,275,452 | 1,275,707 |
| 80% | 80.1% | 1,133,735 | 1,135,519 |
| 70% | 70.0% | 992,018 | 991,716 |
| 60% | 60.1% | 850,301 | 851,635 |
| 50% | 50.2% | 708,584 | 711,171 |
| 40% | 40.0% | 566,868 | 567,055 |
| 30% | 30.1% | 425,151 | 426,257 |
| 20% | 20.2% | 283,434 | 285,729 |
| 10% | 10.0% | 141,717 | 141,072 |
| Active Idle | 0 | 0 | |
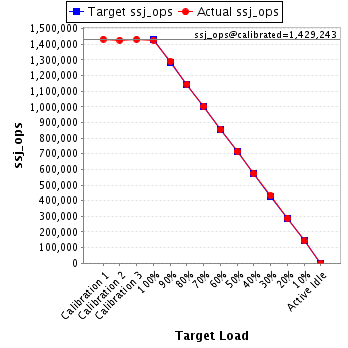
| Target Load | Actual Load | ssj_ops | |
|---|---|---|---|
| Target | Actual | ||
| Calibration 1 | 1,432,621 | ||
| Calibration 2 | 1,426,581 | ||
| Calibration 3 | 1,431,905 | ||
| ssj_ops@calibrated=1,429,243 | |||
| 100% | 99.8% | 1,429,243 | 1,427,027 |
| 90% | 90.3% | 1,286,319 | 1,290,870 |
| 80% | 80.2% | 1,143,395 | 1,145,606 |
| 70% | 70.2% | 1,000,470 | 1,003,478 |
| 60% | 59.9% | 857,546 | 856,431 |
| 50% | 50.0% | 714,622 | 714,929 |
| 40% | 40.2% | 571,697 | 574,579 |
| 30% | 30.1% | 428,773 | 430,423 |
| 20% | 20.1% | 285,849 | 287,936 |
| 10% | 10.0% | 142,924 | 143,080 |
| Active Idle | 0 | 0 | |
| Target Load | Actual Load | ssj_ops | |
|---|---|---|---|
| Target | Actual | ||
| Calibration 1 | 1,413,069 | ||
| Calibration 2 | 1,409,880 | ||
| Calibration 3 | 1,410,201 | ||
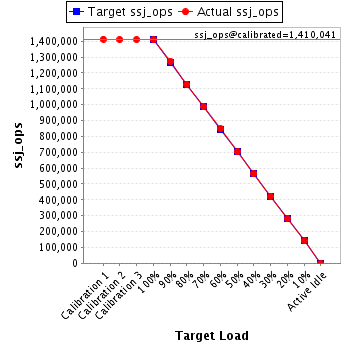
| ssj_ops@calibrated=1,410,041 | |||
| 100% | 99.9% | 1,410,041 | 1,408,912 |
| 90% | 90.4% | 1,269,037 | 1,274,035 |
| 80% | 80.1% | 1,128,032 | 1,129,155 |
| 70% | 69.9% | 987,028 | 986,269 |
| 60% | 60.2% | 846,024 | 849,193 |
| 50% | 49.9% | 705,020 | 704,164 |
| 40% | 40.0% | 564,016 | 563,964 |
| 30% | 30.1% | 423,012 | 423,796 |
| 20% | 19.9% | 282,008 | 280,852 |
| 10% | 10.0% | 141,004 | 141,340 |
| Active Idle | 0 | 0 | |