
SPECpower_ssj2008
Host 'WIN-SUT102' Performance Report
Copyright © 2007-2019 Standard Performance Evaluation Corporation
| New H3C Technologies Co., Ltd. H3C UniServer B5700 G3 | ssj_ops@100% = 5,659,247 ssj_ops@100% per JVM = 1,414,812 |
||||
| Test Sponsor: | New H3C Technologies Co., Ltd. | SPEC License #: | 9066 | Test Method: | Multi Node |
| Tested By: | New H3C Technologies Co., Ltd. | Test Location: | Hangzhou, Zhejiang, China | Test Date: | May 24, 2019 |
| Hardware Availability: | Jan-2019 | Software Availability: | Jan-2019 | Publication: | Jun 26, 2019 |
| System Source: | Single Supplier | System Designation: | Server | Power Provisioning: | Line-powered |
| Target Load | Actual Load | ssj_ops | |
|---|---|---|---|
| Target | Actual | ||
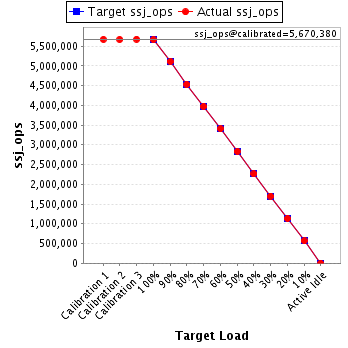
| Calibration 1 | 5,670,353 | ||
| Calibration 2 | 5,665,455 | ||
| Calibration 3 | 5,675,305 | ||
| ssj_ops@calibrated=5,670,380 | |||
| 100% | 99.8% | 5,670,380 | 5,659,247 |
| 90% | 90.1% | 5,103,342 | 5,108,417 |
| 80% | 79.9% | 4,536,304 | 4,529,708 |
| 70% | 70.1% | 3,969,266 | 3,975,464 |
| 60% | 60.0% | 3,402,228 | 3,402,184 |
| 50% | 50.0% | 2,835,190 | 2,832,661 |
| 40% | 39.9% | 2,268,152 | 2,260,844 |
| 30% | 30.0% | 1,701,114 | 1,702,308 |
| 20% | 20.0% | 1,134,076 | 1,134,945 |
| 10% | 10.0% | 567,038 | 565,973 |
| Active Idle | 0 | 0 | |
| Set Identifier: | sut |
| Set Description: | System Under Test |
| # of Identical Nodes: | 16 |
| Comment: | SUT |
| Hardware | |
|---|---|
| Hardware Vendor: | New H3C Technologies Co., Ltd. |
| Model: | H3C UniServer B5700 G3 |
| Form Factor: | other |
| CPU Name: | Intel Xeon Platinum 8180 2.50GHz |
| CPU Characteristics: | 28-Core, 2.50 GHz, 38.5 MB L3 Cache |
| CPU Frequency (MHz): | 2500 |
| CPU(s) Enabled: | 56 cores, 2 chips, 28 cores/chip |
| Hardware Threads: | 112 (2 / core) |
| CPU(s) Orderable: | 1,2 chips |
| Primary Cache: | 32 KB I + 32 KB D on chip per core |
| Secondary Cache: | 1 MB I+D on chip per core |
| Tertiary Cache: | 39424 KB I+D on chip per chip |
| Other Cache: | None |
| Memory Amount (GB): | 192.0 |
| # and size of DIMM: | 12 x 16384 MB |
| Memory Details: | 12 x 16GB 2Rx8 PC4-2666-V ECC;slots A1, A2, A3, A4, A5, A6, B1, B2, B3, B4, B5, B6 populated |
| Power Supply Quantity and Rating (W): | None |
| Power Supply Details: | Shared |
| Disk Drive: | SATA DOM 128GB P/N DESSH-A28D09BCADCA |
| Disk Controller: | Integrated SATA controller |
| # and type of Network Interface Cards (NICs) Installed: | 1 x Intel I350 Gigabit Ethernet Controller |
| NICs Enabled in Firmware / OS / Connected: | 2/2/1 |
| Network Speed (Mbit): | 1000 |
| Keyboard: | None |
| Mouse: | None |
| Monitor: | None |
| Optical Drives: | No |
| Other Hardware: | None |
| Software | |
|---|---|
| Power Management: | Balanced Mode enabled in OS (see SUT Notes) |
| Operating System (OS): | Microsoft Windows Server 2012 R2 Datacenter |
| OS Version: | Version 6.3 (Build 9600) |
| Filesystem: | NTFS |
| JVM Vendor: | Oracle Corporation |
| JVM Version: | Java HotSpot(TM) 64-Bit Server VM (build 24.80-b11, mixed mode), version 1.7.0_80 |
| JVM Command-line Options: | -server -Xmn19g -Xms21g -Xmx21g -XX:SurvivorRatio=1 -XX:TargetSurvivorRatio=99 -XX:ParallelGCThreads=28 -XX:AllocatePrefetchDistance=256 -XX:AllocatePrefetchLines=4 -XX:LoopUnrollLimit=45 -XX:InitialTenuringThreshold=12 -XX:MaxTenuringThreshold=15 -XX:InlineSmallCode=9000 -XX:MaxInlineSize=270 -XX:FreqInlineSize=6000 -XX:+UseLargePages -XX:+UseParallelOldGC -XX:+AggressiveOpts |
| JVM Affinity: | start /NODE [0,2] /AFFINITY [0xFC0FF00FC0FF];start /NODE [1,3] /AFFINITY [0xFF03F00FF03F] |
| JVM Instances: | 4 |
| JVM Initial Heap (MB): | 21000 |
| JVM Maximum Heap (MB): | 21000 |
| JVM Address Bits: | 64 |
| Boot Firmware Version: | 2.00.25 |
| Management Firmware Version: | UIS-OM 1.00.10 |
| Workload Version: | SSJ 1.2.10 |
| Director Location: | Controller |
| Other Software: | Microsoft Windows KB3021910, clearcompressionflag.exe, KB2919355, KB2932046, KB2959977, KB2937592, KB2938439, KB2934018, KB4056898, patched to this test system in May 16, 2019 |
| JVM Instance | ssj_ops@100% |
|---|---|
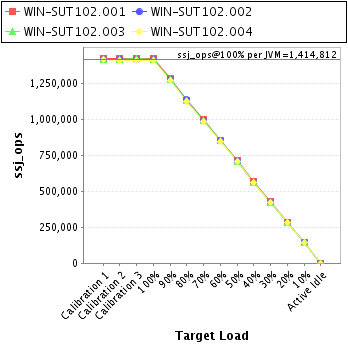
| WIN-SUT102.001 | 1,422,820 |
| WIN-SUT102.002 | 1,414,333 |
| WIN-SUT102.003 | 1,414,120 |
| WIN-SUT102.004 | 1,407,974 |
| ssj_ops@100% | 5,659,247 |
| ssj_ops@100% per JVM | 1,414,812 |
| Target Load | Actual Load | ssj_ops | |
|---|---|---|---|
| Target | Actual | ||
| Calibration 1 | 1,424,570 | ||
| Calibration 2 | 1,421,327 | ||
| Calibration 3 | 1,425,686 | ||
| ssj_ops@calibrated=1,423,506 | |||
| 100% | 100.0% | 1,423,506 | 1,422,820 |
| 90% | 90.0% | 1,281,156 | 1,281,368 |
| 80% | 79.7% | 1,138,805 | 1,134,256 |
| 70% | 70.1% | 996,454 | 998,527 |
| 60% | 60.0% | 854,104 | 854,297 |
| 50% | 50.0% | 711,753 | 711,082 |
| 40% | 40.0% | 569,402 | 569,221 |
| 30% | 30.2% | 427,052 | 430,396 |
| 20% | 20.0% | 284,701 | 285,193 |
| 10% | 10.0% | 142,351 | 141,904 |
| Active Idle | 0 | 0 | |

| Target Load | Actual Load | ssj_ops | |
|---|---|---|---|
| Target | Actual | ||
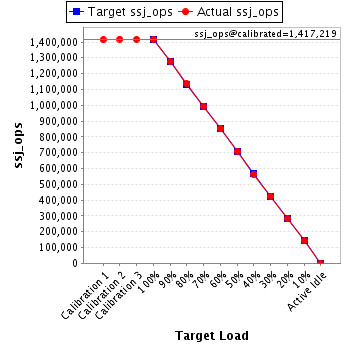
| Calibration 1 | 1,414,314 | ||
| Calibration 2 | 1,417,978 | ||
| Calibration 3 | 1,416,459 | ||
| ssj_ops@calibrated=1,417,219 | |||
| 100% | 99.8% | 1,417,219 | 1,414,333 |
| 90% | 90.1% | 1,275,497 | 1,276,281 |
| 80% | 80.1% | 1,133,775 | 1,135,026 |
| 70% | 70.1% | 992,053 | 994,179 |
| 60% | 60.1% | 850,331 | 851,508 |
| 50% | 50.1% | 708,609 | 709,418 |
| 40% | 39.8% | 566,887 | 564,662 |
| 30% | 30.0% | 425,166 | 424,989 |
| 20% | 19.9% | 283,444 | 281,921 |
| 10% | 10.0% | 141,722 | 141,556 |
| Active Idle | 0 | 0 | |
| Target Load | Actual Load | ssj_ops | |
|---|---|---|---|
| Target | Actual | ||
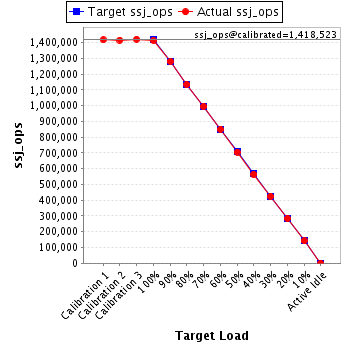
| Calibration 1 | 1,416,775 | ||
| Calibration 2 | 1,415,735 | ||
| Calibration 3 | 1,421,310 | ||
| ssj_ops@calibrated=1,418,523 | |||
| 100% | 99.7% | 1,418,523 | 1,414,120 |
| 90% | 90.3% | 1,276,671 | 1,280,850 |
| 80% | 79.9% | 1,134,818 | 1,133,020 |
| 70% | 70.2% | 992,966 | 995,703 |
| 60% | 60.0% | 851,114 | 850,711 |
| 50% | 49.7% | 709,261 | 705,595 |
| 40% | 39.8% | 567,409 | 564,566 |
| 30% | 29.9% | 425,557 | 424,236 |
| 20% | 20.1% | 283,705 | 284,581 |
| 10% | 10.0% | 141,852 | 141,616 |
| Active Idle | 0 | 0 | |
| Target Load | Actual Load | ssj_ops | |
|---|---|---|---|
| Target | Actual | ||
| Calibration 1 | 1,414,694 | ||
| Calibration 2 | 1,410,415 | ||
| Calibration 3 | 1,411,849 | ||
| ssj_ops@calibrated=1,411,132 | |||
| 100% | 99.8% | 1,411,132 | 1,407,974 |
| 90% | 90.0% | 1,270,019 | 1,269,918 |
| 80% | 79.9% | 1,128,906 | 1,127,406 |
| 70% | 69.9% | 987,793 | 987,056 |
| 60% | 59.9% | 846,679 | 845,668 |
| 50% | 50.1% | 705,566 | 706,566 |
| 40% | 39.9% | 564,453 | 562,395 |
| 30% | 30.0% | 423,340 | 422,687 |
| 20% | 20.1% | 282,226 | 283,251 |
| 10% | 10.0% | 141,113 | 140,898 |
| Active Idle | 0 | 0 | |
