SPECpower_ssj2008
Host 'WIN-SUT114' Performance Report
Copyright © 2007-2019 Standard Performance Evaluation Corporation
| New H3C Technologies Co., Ltd. H3C UniServer B5700 G3 | ssj_ops@100% = 5,719,319 ssj_ops@100% per JVM = 1,429,830 |
||||
| Test Sponsor: | New H3C Technologies Co., Ltd. | SPEC License #: | 9066 | Test Method: | Multi Node |
| Tested By: | New H3C Technologies Co., Ltd. | Test Location: | Hangzhou, Zhejiang, China | Test Date: | May 17, 2019 |
| Hardware Availability: | Jan-2019 | Software Availability: | Jan-2019 | Publication: | Jun 12, 2019 |
| System Source: | Single Supplier | System Designation: | Server | Power Provisioning: | Line-powered |
| Target Load | Actual Load | ssj_ops | |
|---|---|---|---|
| Target | Actual | ||
| Calibration 1 | 5,726,070 | ||
| Calibration 2 | 5,716,468 | ||
| Calibration 3 | 5,728,535 | ||
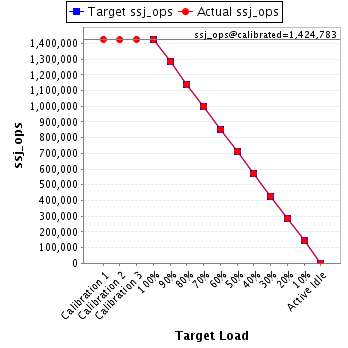
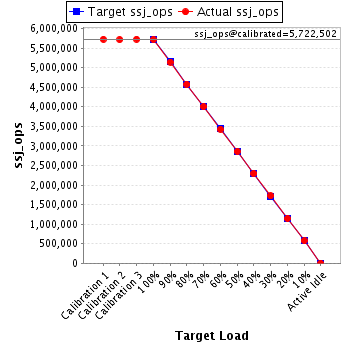
| ssj_ops@calibrated=5,722,502 | |||
| 100% | 99.9% | 5,722,502 | 5,719,319 |
| 90% | 89.9% | 5,150,252 | 5,144,041 |
| 80% | 80.0% | 4,578,002 | 4,575,146 |
| 70% | 70.0% | 4,005,751 | 4,004,907 |
| 60% | 59.9% | 3,433,501 | 3,427,358 |
| 50% | 50.0% | 2,861,251 | 2,859,726 |
| 40% | 40.1% | 2,289,001 | 2,292,491 |
| 30% | 30.1% | 1,716,751 | 1,719,841 |
| 20% | 20.0% | 1,144,500 | 1,144,385 |
| 10% | 10.1% | 572,250 | 575,115 |
| Active Idle | 0 | 0 | |
| Set Identifier: | sut |
| Set Description: | System Under Test |
| # of Identical Nodes: | 14 |
| Comment: | SUT |
| Hardware | |
|---|---|
| Hardware Vendor: | New H3C Technologies Co., Ltd. |
| Model: | H3C UniServer B5700 G3 |
| Form Factor: | Other |
| CPU Name: | Intel Xeon Platinum 8180 2.50GHz |
| CPU Characteristics: | 28-Core, 2.50 GHz, 38.5 MB L3 Cache |
| CPU Frequency (MHz): | 2500 |
| CPU(s) Enabled: | 56 cores, 2 chips, 28 cores/chip |
| Hardware Threads: | 112 (2 / core) |
| CPU(s) Orderable: | 1,2 chips |
| Primary Cache: | 32 KB I + 32 KB D on chip per core |
| Secondary Cache: | 1 MB I+D on chip per core |
| Tertiary Cache: | 39424 KB I+D on chip per chip |
| Other Cache: | None |
| Memory Amount (GB): | 192.0 |
| # and size of DIMM: | 12 x 16384 MB |
| Memory Details: | 12 x 16GB 2Rx8 PC4-2666-V ECC;slots A1, A2, A3, A4, A5, A6, B1, B2, B3, B4, B5, B6 populated |
| Power Supply Quantity and Rating (W): | None |
| Power Supply Details: | Shared |
| Disk Drive: | SATA DOM 128GB P/N DESSH-A28D09BCADCA |
| Disk Controller: | Integrated SATA controller |
| # and type of Network Interface Cards (NICs) Installed: | 1 x Intel I350 Gigabit Ethernet Controller |
| NICs Enabled in Firmware / OS / Connected: | 2/2/1 |
| Network Speed (Mbit): | 1000 |
| Keyboard: | None |
| Mouse: | None |
| Monitor: | None |
| Optical Drives: | No |
| Other Hardware: | None |
| Software | |
|---|---|
| Power Management: | Balanced Mode enabled in OS (see SUT Notes) |
| Operating System (OS): | Microsoft Windows Server 2012 R2 Datacenter |
| OS Version: | Version 6.3 (Build 9600) |
| Filesystem: | NTFS |
| JVM Vendor: | Oracle Corporation |
| JVM Version: | Java HotSpot(TM) 64-Bit Server VM (build 24.80-b11, mixed mode), version 1.7.0_80 |
| JVM Command-line Options: | -server -Xmn19g -Xms21g -Xmx21g -XX:SurvivorRatio=1 -XX:TargetSurvivorRatio=99 -XX:ParallelGCThreads=28 -XX:AllocatePrefetchDistance=256 -XX:AllocatePrefetchLines=4 -XX:LoopUnrollLimit=45 -XX:InitialTenuringThreshold=12 -XX:MaxTenuringThreshold=15 -XX:InlineSmallCode=9000 -XX:MaxInlineSize=270 -XX:FreqInlineSize=6000 -XX:+UseLargePages -XX:+UseParallelOldGC -XX:+AggressiveOpts |
| JVM Affinity: | start /NODE [0,2] /AFFINITY [0xFC0FF00FC0FF];start /NODE [1,3] /AFFINITY [0xFF03F00FF03F] |
| JVM Instances: | 4 |
| JVM Initial Heap (MB): | 21000 |
| JVM Maximum Heap (MB): | 21000 |
| JVM Address Bits: | 64 |
| Boot Firmware Version: | 2.00.25 |
| Management Firmware Version: | UIS-OM 1.00.10 |
| Workload Version: | SSJ 1.2.10 |
| Director Location: | Controller |
| Other Software: | Microsoft Windows KB3021910, clearcompressionflag.exe, KB2919355, KB2932046, KB2959977, KB2937592, KB2938439, KB2934018, KB4056898, patched to this test system in May 15, 2019 |
| JVM Instance | ssj_ops@100% |
|---|---|
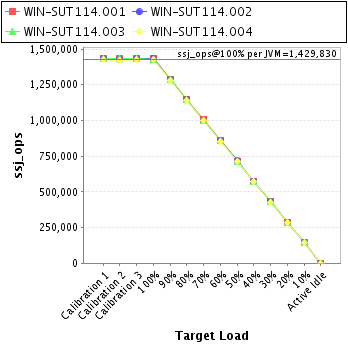
| WIN-SUT114.001 | 1,431,978 |
| WIN-SUT114.002 | 1,432,093 |
| WIN-SUT114.003 | 1,429,916 |
| WIN-SUT114.004 | 1,425,331 |
| ssj_ops@100% | 5,719,319 |
| ssj_ops@100% per JVM | 1,429,830 |
| Target Load | Actual Load | ssj_ops | |
|---|---|---|---|
| Target | Actual | ||
| Calibration 1 | 1,432,784 | ||
| Calibration 2 | 1,433,019 | ||
| Calibration 3 | 1,436,581 | ||
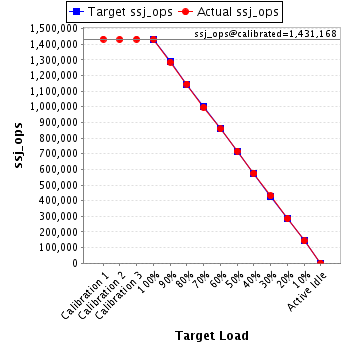
| ssj_ops@calibrated=1,434,800 | |||
| 100% | 99.8% | 1,434,800 | 1,431,978 |
| 90% | 89.9% | 1,291,320 | 1,289,916 |
| 80% | 79.9% | 1,147,840 | 1,146,143 |
| 70% | 70.1% | 1,004,360 | 1,005,683 |
| 60% | 59.9% | 860,880 | 859,841 |
| 50% | 49.7% | 717,400 | 713,345 |
| 40% | 40.1% | 573,920 | 575,693 |
| 30% | 30.2% | 430,440 | 432,946 |
| 20% | 20.0% | 286,960 | 287,164 |
| 10% | 10.1% | 143,480 | 144,808 |
| Active Idle | 0 | 0 | |
| Target Load | Actual Load | ssj_ops | |
|---|---|---|---|
| Target | Actual | ||
| Calibration 1 | 1,432,168 | ||
| Calibration 2 | 1,430,048 | ||
| Calibration 3 | 1,432,289 | ||
| ssj_ops@calibrated=1,431,168 | |||
| 100% | 100.1% | 1,431,168 | 1,432,093 |
| 90% | 89.8% | 1,288,051 | 1,285,651 |
| 80% | 80.0% | 1,144,935 | 1,145,598 |
| 70% | 69.7% | 1,001,818 | 997,307 |
| 60% | 60.0% | 858,701 | 858,306 |
| 50% | 50.1% | 715,584 | 716,621 |
| 40% | 40.2% | 572,467 | 574,836 |
| 30% | 30.0% | 429,350 | 429,998 |
| 20% | 20.0% | 286,234 | 285,599 |
| 10% | 10.0% | 143,117 | 143,330 |
| Active Idle | 0 | 0 | |
| Target Load | Actual Load | ssj_ops | |
|---|---|---|---|
| Target | Actual | ||
| Calibration 1 | 1,434,423 | ||
| Calibration 2 | 1,431,171 | ||
| Calibration 3 | 1,432,330 | ||
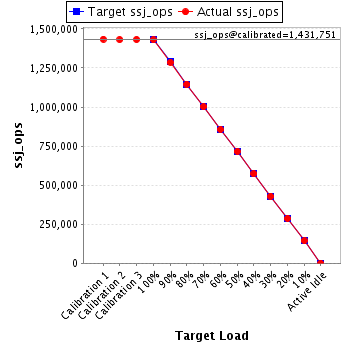
| ssj_ops@calibrated=1,431,751 | |||
| 100% | 99.9% | 1,431,751 | 1,429,916 |
| 90% | 89.8% | 1,288,576 | 1,285,621 |
| 80% | 80.1% | 1,145,401 | 1,146,119 |
| 70% | 70.0% | 1,002,225 | 1,002,163 |
| 60% | 59.8% | 859,050 | 856,864 |
| 50% | 50.0% | 715,875 | 715,954 |
| 40% | 40.0% | 572,700 | 572,246 |
| 30% | 30.0% | 429,525 | 429,372 |
| 20% | 20.0% | 286,350 | 286,515 |
| 10% | 10.1% | 143,175 | 144,248 |
| Active Idle | 0 | 0 | |
| Target Load | Actual Load | ssj_ops | |
|---|---|---|---|
| Target | Actual | ||
| Calibration 1 | 1,426,695 | ||
| Calibration 2 | 1,422,231 | ||
| Calibration 3 | 1,427,336 | ||
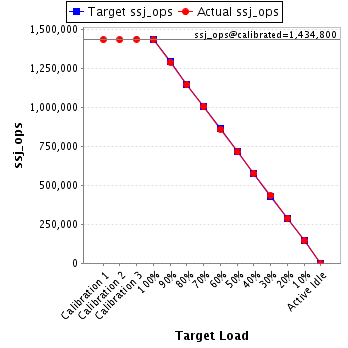
| ssj_ops@calibrated=1,424,783 | |||
| 100% | 100.0% | 1,424,783 | 1,425,331 |
| 90% | 90.0% | 1,282,305 | 1,282,853 |
| 80% | 79.8% | 1,139,827 | 1,137,286 |
| 70% | 70.2% | 997,348 | 999,753 |
| 60% | 59.8% | 854,870 | 852,347 |
| 50% | 50.1% | 712,392 | 713,805 |
| 40% | 40.0% | 569,913 | 569,717 |
| 30% | 30.0% | 427,435 | 427,525 |
| 20% | 20.0% | 284,957 | 285,107 |
| 10% | 10.0% | 142,478 | 142,729 |
| Active Idle | 0 | 0 | |