SPECpower_ssj2008
Host 'WIN-SUT113' Performance Report
Copyright © 2007-2019 Standard Performance Evaluation Corporation
| New H3C Technologies Co., Ltd. H3C UniServer B5700 G3 | ssj_ops@100% = 5,695,613 ssj_ops@100% per JVM = 1,423,903 |
||||
| Test Sponsor: | New H3C Technologies Co., Ltd. | SPEC License #: | 9066 | Test Method: | Multi Node |
| Tested By: | New H3C Technologies Co., Ltd. | Test Location: | Hangzhou, Zhejiang, China | Test Date: | May 17, 2019 |
| Hardware Availability: | Jan-2019 | Software Availability: | Jan-2019 | Publication: | Jun 12, 2019 |
| System Source: | Single Supplier | System Designation: | Server | Power Provisioning: | Line-powered |
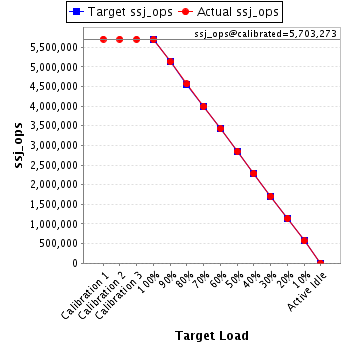
| Target Load | Actual Load | ssj_ops | |
|---|---|---|---|
| Target | Actual | ||
| Calibration 1 | 5,705,775 | ||
| Calibration 2 | 5,702,295 | ||
| Calibration 3 | 5,704,252 | ||
| ssj_ops@calibrated=5,703,273 | |||
| 100% | 99.9% | 5,703,273 | 5,695,613 |
| 90% | 90.0% | 5,132,946 | 5,131,483 |
| 80% | 80.1% | 4,562,619 | 4,565,791 |
| 70% | 70.1% | 3,992,291 | 3,995,468 |
| 60% | 60.1% | 3,421,964 | 3,424,863 |
| 50% | 49.9% | 2,851,637 | 2,848,286 |
| 40% | 40.0% | 2,281,309 | 2,283,830 |
| 30% | 30.0% | 1,710,982 | 1,708,198 |
| 20% | 20.0% | 1,140,655 | 1,141,438 |
| 10% | 10.0% | 570,327 | 570,048 |
| Active Idle | 0 | 0 | |
| Set Identifier: | sut |
| Set Description: | System Under Test |
| # of Identical Nodes: | 14 |
| Comment: | SUT |
| Hardware | |
|---|---|
| Hardware Vendor: | New H3C Technologies Co., Ltd. |
| Model: | H3C UniServer B5700 G3 |
| Form Factor: | Other |
| CPU Name: | Intel Xeon Platinum 8180 2.50GHz |
| CPU Characteristics: | 28-Core, 2.50 GHz, 38.5 MB L3 Cache |
| CPU Frequency (MHz): | 2500 |
| CPU(s) Enabled: | 56 cores, 2 chips, 28 cores/chip |
| Hardware Threads: | 112 (2 / core) |
| CPU(s) Orderable: | 1,2 chips |
| Primary Cache: | 32 KB I + 32 KB D on chip per core |
| Secondary Cache: | 1 MB I+D on chip per core |
| Tertiary Cache: | 39424 KB I+D on chip per chip |
| Other Cache: | None |
| Memory Amount (GB): | 192.0 |
| # and size of DIMM: | 12 x 16384 MB |
| Memory Details: | 12 x 16GB 2Rx8 PC4-2666-V ECC;slots A1, A2, A3, A4, A5, A6, B1, B2, B3, B4, B5, B6 populated |
| Power Supply Quantity and Rating (W): | None |
| Power Supply Details: | Shared |
| Disk Drive: | SATA DOM 128GB P/N DESSH-A28D09BCADCA |
| Disk Controller: | Integrated SATA controller |
| # and type of Network Interface Cards (NICs) Installed: | 1 x Intel I350 Gigabit Ethernet Controller |
| NICs Enabled in Firmware / OS / Connected: | 2/2/1 |
| Network Speed (Mbit): | 1000 |
| Keyboard: | None |
| Mouse: | None |
| Monitor: | None |
| Optical Drives: | No |
| Other Hardware: | None |
| Software | |
|---|---|
| Power Management: | Balanced Mode enabled in OS (see SUT Notes) |
| Operating System (OS): | Microsoft Windows Server 2012 R2 Datacenter |
| OS Version: | Version 6.3 (Build 9600) |
| Filesystem: | NTFS |
| JVM Vendor: | Oracle Corporation |
| JVM Version: | Java HotSpot(TM) 64-Bit Server VM (build 24.80-b11, mixed mode), version 1.7.0_80 |
| JVM Command-line Options: | -server -Xmn19g -Xms21g -Xmx21g -XX:SurvivorRatio=1 -XX:TargetSurvivorRatio=99 -XX:ParallelGCThreads=28 -XX:AllocatePrefetchDistance=256 -XX:AllocatePrefetchLines=4 -XX:LoopUnrollLimit=45 -XX:InitialTenuringThreshold=12 -XX:MaxTenuringThreshold=15 -XX:InlineSmallCode=9000 -XX:MaxInlineSize=270 -XX:FreqInlineSize=6000 -XX:+UseLargePages -XX:+UseParallelOldGC -XX:+AggressiveOpts |
| JVM Affinity: | start /NODE [0,2] /AFFINITY [0xFC0FF00FC0FF];start /NODE [1,3] /AFFINITY [0xFF03F00FF03F] |
| JVM Instances: | 4 |
| JVM Initial Heap (MB): | 21000 |
| JVM Maximum Heap (MB): | 21000 |
| JVM Address Bits: | 64 |
| Boot Firmware Version: | 2.00.25 |
| Management Firmware Version: | UIS-OM 1.00.10 |
| Workload Version: | SSJ 1.2.10 |
| Director Location: | Controller |
| Other Software: | Microsoft Windows KB3021910, clearcompressionflag.exe, KB2919355, KB2932046, KB2959977, KB2937592, KB2938439, KB2934018, KB4056898, patched to this test system in May 15, 2019 |
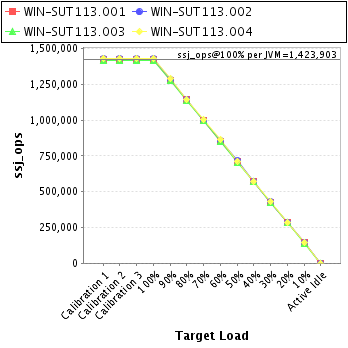
| JVM Instance | ssj_ops@100% |
|---|---|
| WIN-SUT113.001 | 1,423,536 |
| WIN-SUT113.002 | 1,428,019 |
| WIN-SUT113.003 | 1,415,259 |
| WIN-SUT113.004 | 1,428,798 |
| ssj_ops@100% | 5,695,613 |
| ssj_ops@100% per JVM | 1,423,903 |
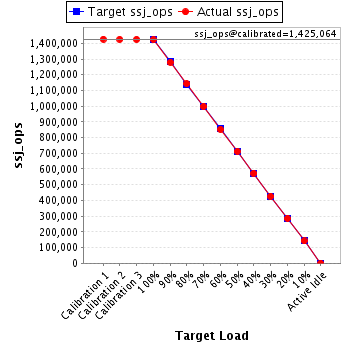
| Target Load | Actual Load | ssj_ops | |
|---|---|---|---|
| Target | Actual | ||
| Calibration 1 | 1,426,394 | ||
| Calibration 2 | 1,425,208 | ||
| Calibration 3 | 1,424,920 | ||
| ssj_ops@calibrated=1,425,064 | |||
| 100% | 99.9% | 1,425,064 | 1,423,536 |
| 90% | 89.8% | 1,282,557 | 1,279,004 |
| 80% | 80.2% | 1,140,051 | 1,143,582 |
| 70% | 70.1% | 997,545 | 998,465 |
| 60% | 59.8% | 855,038 | 852,285 |
| 50% | 50.0% | 712,532 | 711,936 |
| 40% | 40.2% | 570,025 | 572,432 |
| 30% | 29.9% | 427,519 | 426,300 |
| 20% | 20.1% | 285,013 | 285,742 |
| 10% | 9.9% | 142,506 | 141,790 |
| Active Idle | 0 | 0 | |
| Target Load | Actual Load | ssj_ops | |
|---|---|---|---|
| Target | Actual | ||
| Calibration 1 | 1,429,013 | ||
| Calibration 2 | 1,430,296 | ||
| Calibration 3 | 1,427,281 | ||
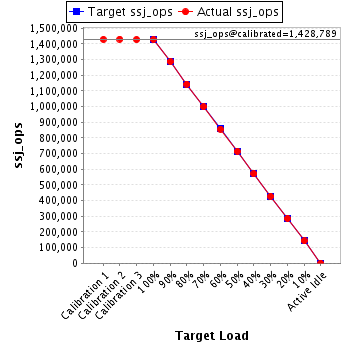
| ssj_ops@calibrated=1,428,789 | |||
| 100% | 99.9% | 1,428,789 | 1,428,019 |
| 90% | 90.1% | 1,285,910 | 1,286,747 |
| 80% | 80.0% | 1,143,031 | 1,143,479 |
| 70% | 69.9% | 1,000,152 | 998,991 |
| 60% | 60.0% | 857,273 | 856,768 |
| 50% | 50.0% | 714,394 | 714,635 |
| 40% | 39.9% | 571,516 | 570,416 |
| 30% | 30.0% | 428,637 | 428,041 |
| 20% | 20.0% | 285,758 | 285,857 |
| 10% | 10.0% | 142,879 | 142,667 |
| Active Idle | 0 | 0 | |
| Target Load | Actual Load | ssj_ops | |
|---|---|---|---|
| Target | Actual | ||
| Calibration 1 | 1,418,320 | ||
| Calibration 2 | 1,416,218 | ||
| Calibration 3 | 1,419,136 | ||
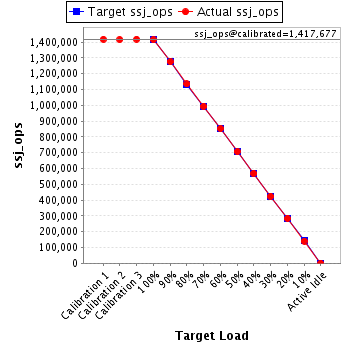
| ssj_ops@calibrated=1,417,677 | |||
| 100% | 99.8% | 1,417,677 | 1,415,259 |
| 90% | 90.0% | 1,275,909 | 1,276,205 |
| 80% | 80.1% | 1,134,141 | 1,135,497 |
| 70% | 70.2% | 992,374 | 995,264 |
| 60% | 60.1% | 850,606 | 852,429 |
| 50% | 49.9% | 708,838 | 707,267 |
| 40% | 40.1% | 567,071 | 568,220 |
| 30% | 29.9% | 425,303 | 423,997 |
| 20% | 20.0% | 283,535 | 284,134 |
| 10% | 9.9% | 141,768 | 140,355 |
| Active Idle | 0 | 0 | |
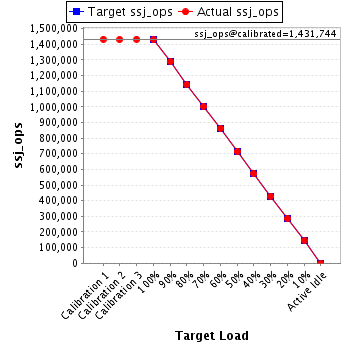
| Target Load | Actual Load | ssj_ops | |
|---|---|---|---|
| Target | Actual | ||
| Calibration 1 | 1,432,048 | ||
| Calibration 2 | 1,430,574 | ||
| Calibration 3 | 1,432,915 | ||
| ssj_ops@calibrated=1,431,744 | |||
| 100% | 99.8% | 1,431,744 | 1,428,798 |
| 90% | 90.1% | 1,288,570 | 1,289,528 |
| 80% | 79.8% | 1,145,395 | 1,143,234 |
| 70% | 70.0% | 1,002,221 | 1,002,748 |
| 60% | 60.3% | 859,047 | 863,381 |
| 50% | 49.9% | 715,872 | 714,448 |
| 40% | 40.0% | 572,698 | 572,762 |
| 30% | 30.0% | 429,523 | 429,860 |
| 20% | 20.0% | 286,349 | 285,705 |
| 10% | 10.1% | 143,174 | 145,236 |
| Active Idle | 0 | 0 | |