SPECpower_ssj2008
Host 'WIN-SUT111' Performance Report
Copyright © 2007-2019 Standard Performance Evaluation Corporation
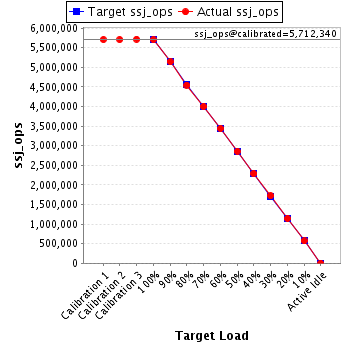
| New H3C Technologies Co., Ltd. H3C UniServer B5700 G3 | ssj_ops@100% = 5,703,697 ssj_ops@100% per JVM = 1,425,924 |
||||
| Test Sponsor: | New H3C Technologies Co., Ltd. | SPEC License #: | 9066 | Test Method: | Multi Node |
| Tested By: | New H3C Technologies Co., Ltd. | Test Location: | Hangzhou, Zhejiang, China | Test Date: | May 17, 2019 |
| Hardware Availability: | Jan-2019 | Software Availability: | Jan-2019 | Publication: | Jun 12, 2019 |
| System Source: | Single Supplier | System Designation: | Server | Power Provisioning: | Line-powered |
| Target Load | Actual Load | ssj_ops | |
|---|---|---|---|
| Target | Actual | ||
| Calibration 1 | 5,705,515 | ||
| Calibration 2 | 5,706,506 | ||
| Calibration 3 | 5,718,174 | ||
| ssj_ops@calibrated=5,712,340 | |||
| 100% | 99.8% | 5,712,340 | 5,703,697 |
| 90% | 90.0% | 5,141,106 | 5,141,290 |
| 80% | 79.6% | 4,569,872 | 4,547,578 |
| 70% | 70.1% | 3,998,638 | 4,001,877 |
| 60% | 60.2% | 3,427,404 | 3,439,736 |
| 50% | 50.0% | 2,856,170 | 2,858,013 |
| 40% | 40.0% | 2,284,936 | 2,282,994 |
| 30% | 30.1% | 1,713,702 | 1,718,078 |
| 20% | 20.0% | 1,142,468 | 1,141,995 |
| 10% | 10.0% | 571,234 | 569,073 |
| Active Idle | 0 | 0 | |
| Set Identifier: | sut |
| Set Description: | System Under Test |
| # of Identical Nodes: | 14 |
| Comment: | SUT |
| Hardware | |
|---|---|
| Hardware Vendor: | New H3C Technologies Co., Ltd. |
| Model: | H3C UniServer B5700 G3 |
| Form Factor: | Other |
| CPU Name: | Intel Xeon Platinum 8180 2.50GHz |
| CPU Characteristics: | 28-Core, 2.50 GHz, 38.5 MB L3 Cache |
| CPU Frequency (MHz): | 2500 |
| CPU(s) Enabled: | 56 cores, 2 chips, 28 cores/chip |
| Hardware Threads: | 112 (2 / core) |
| CPU(s) Orderable: | 1,2 chips |
| Primary Cache: | 32 KB I + 32 KB D on chip per core |
| Secondary Cache: | 1 MB I+D on chip per core |
| Tertiary Cache: | 39424 KB I+D on chip per chip |
| Other Cache: | None |
| Memory Amount (GB): | 192.0 |
| # and size of DIMM: | 12 x 16384 MB |
| Memory Details: | 12 x 16GB 2Rx8 PC4-2666-V ECC;slots A1, A2, A3, A4, A5, A6, B1, B2, B3, B4, B5, B6 populated |
| Power Supply Quantity and Rating (W): | None |
| Power Supply Details: | Shared |
| Disk Drive: | SATA DOM 128GB P/N DESSH-A28D09BCADCA |
| Disk Controller: | Integrated SATA controller |
| # and type of Network Interface Cards (NICs) Installed: | 1 x Intel I350 Gigabit Ethernet Controller |
| NICs Enabled in Firmware / OS / Connected: | 2/2/1 |
| Network Speed (Mbit): | 1000 |
| Keyboard: | None |
| Mouse: | None |
| Monitor: | None |
| Optical Drives: | No |
| Other Hardware: | None |
| Software | |
|---|---|
| Power Management: | Balanced Mode enabled in OS (see SUT Notes) |
| Operating System (OS): | Microsoft Windows Server 2012 R2 Datacenter |
| OS Version: | Version 6.3 (Build 9600) |
| Filesystem: | NTFS |
| JVM Vendor: | Oracle Corporation |
| JVM Version: | Java HotSpot(TM) 64-Bit Server VM (build 24.80-b11, mixed mode), version 1.7.0_80 |
| JVM Command-line Options: | -server -Xmn19g -Xms21g -Xmx21g -XX:SurvivorRatio=1 -XX:TargetSurvivorRatio=99 -XX:ParallelGCThreads=28 -XX:AllocatePrefetchDistance=256 -XX:AllocatePrefetchLines=4 -XX:LoopUnrollLimit=45 -XX:InitialTenuringThreshold=12 -XX:MaxTenuringThreshold=15 -XX:InlineSmallCode=9000 -XX:MaxInlineSize=270 -XX:FreqInlineSize=6000 -XX:+UseLargePages -XX:+UseParallelOldGC -XX:+AggressiveOpts |
| JVM Affinity: | start /NODE [0,2] /AFFINITY [0xFC0FF00FC0FF];start /NODE [1,3] /AFFINITY [0xFF03F00FF03F] |
| JVM Instances: | 4 |
| JVM Initial Heap (MB): | 21000 |
| JVM Maximum Heap (MB): | 21000 |
| JVM Address Bits: | 64 |
| Boot Firmware Version: | 2.00.25 |
| Management Firmware Version: | UIS-OM 1.00.10 |
| Workload Version: | SSJ 1.2.10 |
| Director Location: | Controller |
| Other Software: | Microsoft Windows KB3021910, clearcompressionflag.exe, KB2919355, KB2932046, KB2959977, KB2937592, KB2938439, KB2934018, KB4056898, patched to this test system in May 15, 2019 |
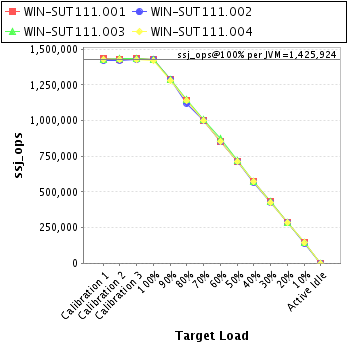
| JVM Instance | ssj_ops@100% |
|---|---|
| WIN-SUT111.001 | 1,426,367 |
| WIN-SUT111.002 | 1,424,771 |
| WIN-SUT111.003 | 1,430,809 |
| WIN-SUT111.004 | 1,421,750 |
| ssj_ops@100% | 5,703,697 |
| ssj_ops@100% per JVM | 1,425,924 |
| Target Load | Actual Load | ssj_ops | |
|---|---|---|---|
| Target | Actual | ||
| Calibration 1 | 1,431,488 | ||
| Calibration 2 | 1,426,655 | ||
| Calibration 3 | 1,431,127 | ||
| ssj_ops@calibrated=1,428,891 | |||
| 100% | 99.8% | 1,428,891 | 1,426,367 |
| 90% | 90.2% | 1,286,002 | 1,288,528 |
| 80% | 79.8% | 1,143,113 | 1,140,644 |
| 70% | 69.9% | 1,000,224 | 999,508 |
| 60% | 59.9% | 857,335 | 856,161 |
| 50% | 49.9% | 714,446 | 713,697 |
| 40% | 40.0% | 571,556 | 571,410 |
| 30% | 30.0% | 428,667 | 429,329 |
| 20% | 20.0% | 285,778 | 285,327 |
| 10% | 10.0% | 142,889 | 143,048 |
| Active Idle | 0 | 0 | |

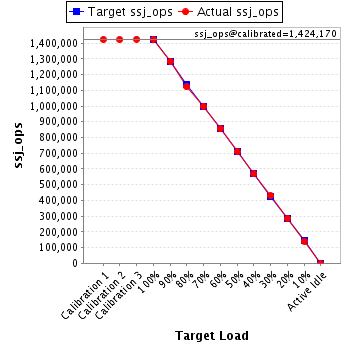
| Target Load | Actual Load | ssj_ops | |
|---|---|---|---|
| Target | Actual | ||
| Calibration 1 | 1,422,448 | ||
| Calibration 2 | 1,422,890 | ||
| Calibration 3 | 1,425,449 | ||
| ssj_ops@calibrated=1,424,170 | |||
| 100% | 100.0% | 1,424,170 | 1,424,771 |
| 90% | 90.2% | 1,281,753 | 1,284,046 |
| 80% | 78.8% | 1,139,336 | 1,121,837 |
| 70% | 70.1% | 996,919 | 997,869 |
| 60% | 60.1% | 854,502 | 855,897 |
| 50% | 50.0% | 712,085 | 711,430 |
| 40% | 39.9% | 569,668 | 567,848 |
| 30% | 30.1% | 427,251 | 428,652 |
| 20% | 20.0% | 284,834 | 284,477 |
| 10% | 9.9% | 142,417 | 140,847 |
| Active Idle | 0 | 0 | |
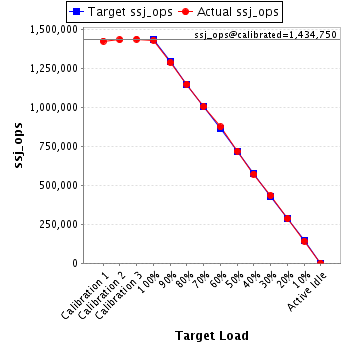
| Target Load | Actual Load | ssj_ops | |
|---|---|---|---|
| Target | Actual | ||
| Calibration 1 | 1,424,979 | ||
| Calibration 2 | 1,432,765 | ||
| Calibration 3 | 1,436,736 | ||
| ssj_ops@calibrated=1,434,750 | |||
| 100% | 99.7% | 1,434,750 | 1,430,809 |
| 90% | 89.7% | 1,291,275 | 1,287,335 |
| 80% | 80.0% | 1,147,800 | 1,147,656 |
| 70% | 70.0% | 1,004,325 | 1,004,977 |
| 60% | 60.9% | 860,850 | 873,887 |
| 50% | 50.1% | 717,375 | 718,886 |
| 40% | 39.9% | 573,900 | 572,116 |
| 30% | 30.2% | 430,425 | 433,652 |
| 20% | 19.9% | 286,950 | 285,970 |
| 10% | 9.9% | 143,475 | 142,262 |
| Active Idle | 0 | 0 | |
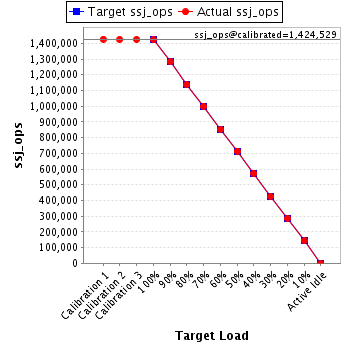
| Target Load | Actual Load | ssj_ops | |
|---|---|---|---|
| Target | Actual | ||
| Calibration 1 | 1,426,600 | ||
| Calibration 2 | 1,424,196 | ||
| Calibration 3 | 1,424,862 | ||
| ssj_ops@calibrated=1,424,529 | |||
| 100% | 99.8% | 1,424,529 | 1,421,750 |
| 90% | 90.0% | 1,282,076 | 1,281,381 |
| 80% | 79.8% | 1,139,623 | 1,137,440 |
| 70% | 70.2% | 997,170 | 999,523 |
| 60% | 59.9% | 854,717 | 853,791 |
| 50% | 50.1% | 712,265 | 714,000 |
| 40% | 40.1% | 569,812 | 571,621 |
| 30% | 29.9% | 427,359 | 426,446 |
| 20% | 20.1% | 284,906 | 286,221 |
| 10% | 10.0% | 142,453 | 142,916 |
| Active Idle | 0 | 0 | |