SPECpower_ssj2008
Host 'WIN-SUT110' Performance Report
Copyright © 2007-2019 Standard Performance Evaluation Corporation
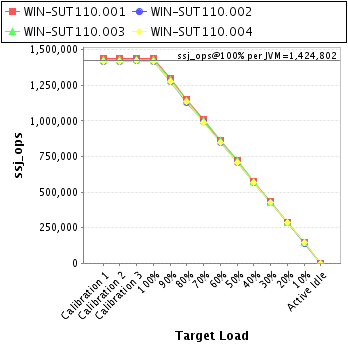
| New H3C Technologies Co., Ltd. H3C UniServer B5700 G3 | ssj_ops@100% = 5,699,210 ssj_ops@100% per JVM = 1,424,802 |
||||
| Test Sponsor: | New H3C Technologies Co., Ltd. | SPEC License #: | 9066 | Test Method: | Multi Node |
| Tested By: | New H3C Technologies Co., Ltd. | Test Location: | Hangzhou, Zhejiang, China | Test Date: | May 17, 2019 |
| Hardware Availability: | Jan-2019 | Software Availability: | Jan-2019 | Publication: | Jun 12, 2019 |
| System Source: | Single Supplier | System Designation: | Server | Power Provisioning: | Line-powered |
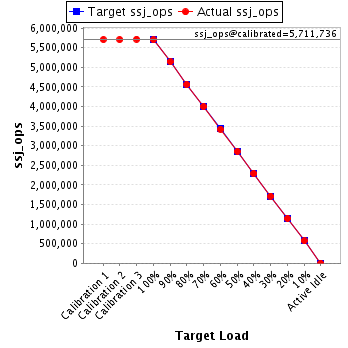
| Target Load | Actual Load | ssj_ops | |
|---|---|---|---|
| Target | Actual | ||
| Calibration 1 | 5,706,418 | ||
| Calibration 2 | 5,705,423 | ||
| Calibration 3 | 5,718,049 | ||
| ssj_ops@calibrated=5,711,736 | |||
| 100% | 99.8% | 5,711,736 | 5,699,210 |
| 90% | 90.0% | 5,140,563 | 5,140,940 |
| 80% | 79.9% | 4,569,389 | 4,562,800 |
| 70% | 70.0% | 3,998,215 | 4,000,701 |
| 60% | 59.9% | 3,427,042 | 3,422,466 |
| 50% | 50.0% | 2,855,868 | 2,855,423 |
| 40% | 40.0% | 2,284,694 | 2,286,592 |
| 30% | 30.0% | 1,713,521 | 1,715,094 |
| 20% | 20.0% | 1,142,347 | 1,143,092 |
| 10% | 10.0% | 571,174 | 572,358 |
| Active Idle | 0 | 0 | |
| Set Identifier: | sut |
| Set Description: | System Under Test |
| # of Identical Nodes: | 14 |
| Comment: | SUT |
| Hardware | |
|---|---|
| Hardware Vendor: | New H3C Technologies Co., Ltd. |
| Model: | H3C UniServer B5700 G3 |
| Form Factor: | Other |
| CPU Name: | Intel Xeon Platinum 8180 2.50GHz |
| CPU Characteristics: | 28-Core, 2.50 GHz, 38.5 MB L3 Cache |
| CPU Frequency (MHz): | 2500 |
| CPU(s) Enabled: | 56 cores, 2 chips, 28 cores/chip |
| Hardware Threads: | 112 (2 / core) |
| CPU(s) Orderable: | 1,2 chips |
| Primary Cache: | 32 KB I + 32 KB D on chip per core |
| Secondary Cache: | 1 MB I+D on chip per core |
| Tertiary Cache: | 39424 KB I+D on chip per chip |
| Other Cache: | None |
| Memory Amount (GB): | 192.0 |
| # and size of DIMM: | 12 x 16384 MB |
| Memory Details: | 12 x 16GB 2Rx8 PC4-2666-V ECC;slots A1, A2, A3, A4, A5, A6, B1, B2, B3, B4, B5, B6 populated |
| Power Supply Quantity and Rating (W): | None |
| Power Supply Details: | Shared |
| Disk Drive: | SATA DOM 128GB P/N DESSH-A28D09BCADCA |
| Disk Controller: | Integrated SATA controller |
| # and type of Network Interface Cards (NICs) Installed: | 1 x Intel I350 Gigabit Ethernet Controller |
| NICs Enabled in Firmware / OS / Connected: | 2/2/1 |
| Network Speed (Mbit): | 1000 |
| Keyboard: | None |
| Mouse: | None |
| Monitor: | None |
| Optical Drives: | No |
| Other Hardware: | None |
| Software | |
|---|---|
| Power Management: | Balanced Mode enabled in OS (see SUT Notes) |
| Operating System (OS): | Microsoft Windows Server 2012 R2 Datacenter |
| OS Version: | Version 6.3 (Build 9600) |
| Filesystem: | NTFS |
| JVM Vendor: | Oracle Corporation |
| JVM Version: | Java HotSpot(TM) 64-Bit Server VM (build 24.80-b11, mixed mode), version 1.7.0_80 |
| JVM Command-line Options: | -server -Xmn19g -Xms21g -Xmx21g -XX:SurvivorRatio=1 -XX:TargetSurvivorRatio=99 -XX:ParallelGCThreads=28 -XX:AllocatePrefetchDistance=256 -XX:AllocatePrefetchLines=4 -XX:LoopUnrollLimit=45 -XX:InitialTenuringThreshold=12 -XX:MaxTenuringThreshold=15 -XX:InlineSmallCode=9000 -XX:MaxInlineSize=270 -XX:FreqInlineSize=6000 -XX:+UseLargePages -XX:+UseParallelOldGC -XX:+AggressiveOpts |
| JVM Affinity: | start /NODE [0,2] /AFFINITY [0xFC0FF00FC0FF];start /NODE [1,3] /AFFINITY [0xFF03F00FF03F] |
| JVM Instances: | 4 |
| JVM Initial Heap (MB): | 21000 |
| JVM Maximum Heap (MB): | 21000 |
| JVM Address Bits: | 64 |
| Boot Firmware Version: | 2.00.25 |
| Management Firmware Version: | UIS-OM 1.00.10 |
| Workload Version: | SSJ 1.2.10 |
| Director Location: | Controller |
| Other Software: | Microsoft Windows KB3021910, clearcompressionflag.exe, KB2919355, KB2932046, KB2959977, KB2937592, KB2938439, KB2934018, KB4056898, patched to this test system in May 15, 2019 |
| JVM Instance | ssj_ops@100% |
|---|---|
| WIN-SUT110.001 | 1,435,411 |
| WIN-SUT110.002 | 1,417,482 |
| WIN-SUT110.003 | 1,431,106 |
| WIN-SUT110.004 | 1,415,211 |
| ssj_ops@100% | 5,699,210 |
| ssj_ops@100% per JVM | 1,424,802 |
| Target Load | Actual Load | ssj_ops | |
|---|---|---|---|
| Target | Actual | ||
| Calibration 1 | 1,440,506 | ||
| Calibration 2 | 1,439,223 | ||
| Calibration 3 | 1,440,545 | ||
| ssj_ops@calibrated=1,439,884 | |||
| 100% | 99.7% | 1,439,884 | 1,435,411 |
| 90% | 90.0% | 1,295,896 | 1,296,183 |
| 80% | 79.9% | 1,151,907 | 1,150,465 |
| 70% | 70.2% | 1,007,919 | 1,011,115 |
| 60% | 60.0% | 863,930 | 863,654 |
| 50% | 50.0% | 719,942 | 719,741 |
| 40% | 40.0% | 575,954 | 575,913 |
| 30% | 30.0% | 431,965 | 432,176 |
| 20% | 19.9% | 287,977 | 287,051 |
| 10% | 10.0% | 143,988 | 143,393 |
| Active Idle | 0 | 0 | |
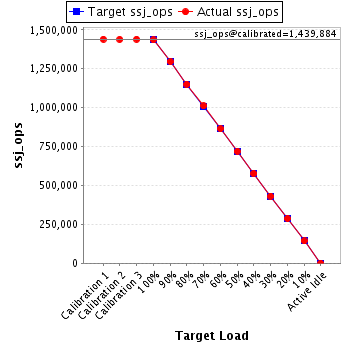
| Target Load | Actual Load | ssj_ops | |
|---|---|---|---|
| Target | Actual | ||
| Calibration 1 | 1,416,777 | ||
| Calibration 2 | 1,416,800 | ||
| Calibration 3 | 1,421,832 | ||
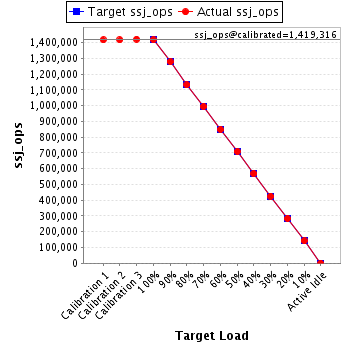
| ssj_ops@calibrated=1,419,316 | |||
| 100% | 99.9% | 1,419,316 | 1,417,482 |
| 90% | 90.1% | 1,277,384 | 1,278,239 |
| 80% | 79.8% | 1,135,453 | 1,132,127 |
| 70% | 70.1% | 993,521 | 995,114 |
| 60% | 59.8% | 851,589 | 849,103 |
| 50% | 49.9% | 709,658 | 708,790 |
| 40% | 40.0% | 567,726 | 567,877 |
| 30% | 30.0% | 425,795 | 426,045 |
| 20% | 20.0% | 283,863 | 283,201 |
| 10% | 10.0% | 141,932 | 141,771 |
| Active Idle | 0 | 0 | |
| Target Load | Actual Load | ssj_ops | |
|---|---|---|---|
| Target | Actual | ||
| Calibration 1 | 1,432,099 | ||
| Calibration 2 | 1,432,968 | ||
| Calibration 3 | 1,433,826 | ||
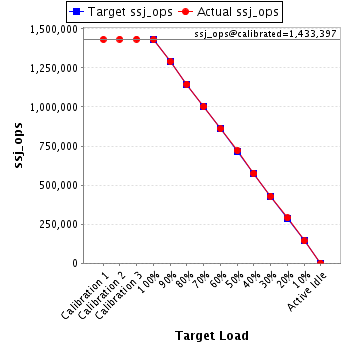
| ssj_ops@calibrated=1,433,397 | |||
| 100% | 99.8% | 1,433,397 | 1,431,106 |
| 90% | 90.1% | 1,290,058 | 1,290,784 |
| 80% | 79.9% | 1,146,718 | 1,145,245 |
| 70% | 70.0% | 1,003,378 | 1,003,410 |
| 60% | 60.0% | 860,038 | 859,743 |
| 50% | 50.2% | 716,699 | 720,268 |
| 40% | 40.1% | 573,359 | 574,080 |
| 30% | 30.0% | 430,019 | 429,412 |
| 20% | 20.2% | 286,679 | 289,721 |
| 10% | 10.0% | 143,340 | 143,257 |
| Active Idle | 0 | 0 | |
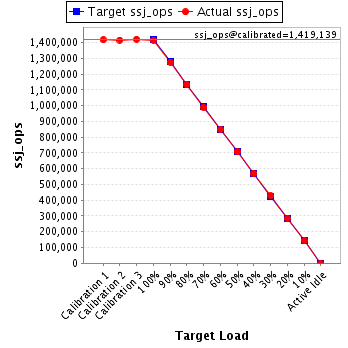
| Target Load | Actual Load | ssj_ops | |
|---|---|---|---|
| Target | Actual | ||
| Calibration 1 | 1,417,036 | ||
| Calibration 2 | 1,416,432 | ||
| Calibration 3 | 1,421,846 | ||
| ssj_ops@calibrated=1,419,139 | |||
| 100% | 99.7% | 1,419,139 | 1,415,211 |
| 90% | 89.9% | 1,277,225 | 1,275,734 |
| 80% | 80.0% | 1,135,311 | 1,134,963 |
| 70% | 69.8% | 993,397 | 991,062 |
| 60% | 59.9% | 851,483 | 849,966 |
| 50% | 49.8% | 709,570 | 706,624 |
| 40% | 40.1% | 567,656 | 568,722 |
| 30% | 30.1% | 425,742 | 427,461 |
| 20% | 20.0% | 283,828 | 283,119 |
| 10% | 10.1% | 141,914 | 143,937 |
| Active Idle | 0 | 0 | |