SPECpower_ssj2008
Host 'WIN-SUT108' Performance Report
Copyright © 2007-2019 Standard Performance Evaluation Corporation
| New H3C Technologies Co., Ltd. H3C UniServer B5700 G3 | ssj_ops@100% = 5,701,276 ssj_ops@100% per JVM = 1,425,319 |
||||
| Test Sponsor: | New H3C Technologies Co., Ltd. | SPEC License #: | 9066 | Test Method: | Multi Node |
| Tested By: | New H3C Technologies Co., Ltd. | Test Location: | Hangzhou, Zhejiang, China | Test Date: | May 17, 2019 |
| Hardware Availability: | Jan-2019 | Software Availability: | Jan-2019 | Publication: | Jun 12, 2019 |
| System Source: | Single Supplier | System Designation: | Server | Power Provisioning: | Line-powered |
| Target Load | Actual Load | ssj_ops | |
|---|---|---|---|
| Target | Actual | ||
| Calibration 1 | 5,713,216 | ||
| Calibration 2 | 5,707,958 | ||
| Calibration 3 | 5,710,426 | ||
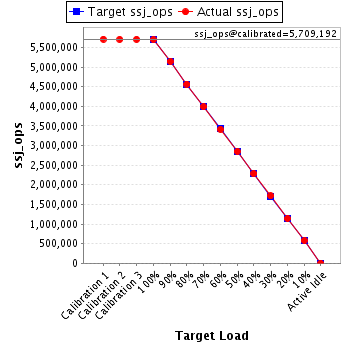
| ssj_ops@calibrated=5,709,192 | |||
| 100% | 99.9% | 5,709,192 | 5,701,276 |
| 90% | 90.1% | 5,138,273 | 5,145,963 |
| 80% | 80.0% | 4,567,353 | 4,567,977 |
| 70% | 69.9% | 3,996,434 | 3,990,179 |
| 60% | 59.9% | 3,425,515 | 3,417,477 |
| 50% | 50.0% | 2,854,596 | 2,852,953 |
| 40% | 40.0% | 2,283,677 | 2,282,832 |
| 30% | 30.0% | 1,712,758 | 1,715,297 |
| 20% | 20.0% | 1,141,838 | 1,141,410 |
| 10% | 10.2% | 570,919 | 581,070 |
| Active Idle | 0 | 0 | |
| Set Identifier: | sut |
| Set Description: | System Under Test |
| # of Identical Nodes: | 14 |
| Comment: | SUT |
| Hardware | |
|---|---|
| Hardware Vendor: | New H3C Technologies Co., Ltd. |
| Model: | H3C UniServer B5700 G3 |
| Form Factor: | Other |
| CPU Name: | Intel Xeon Platinum 8180 2.50GHz |
| CPU Characteristics: | 28-Core, 2.50 GHz, 38.5 MB L3 Cache |
| CPU Frequency (MHz): | 2500 |
| CPU(s) Enabled: | 56 cores, 2 chips, 28 cores/chip |
| Hardware Threads: | 112 (2 / core) |
| CPU(s) Orderable: | 1,2 chips |
| Primary Cache: | 32 KB I + 32 KB D on chip per core |
| Secondary Cache: | 1 MB I+D on chip per core |
| Tertiary Cache: | 39424 KB I+D on chip per chip |
| Other Cache: | None |
| Memory Amount (GB): | 192.0 |
| # and size of DIMM: | 12 x 16384 MB |
| Memory Details: | 12 x 16GB 2Rx8 PC4-2666-V ECC;slots A1, A2, A3, A4, A5, A6, B1, B2, B3, B4, B5, B6 populated |
| Power Supply Quantity and Rating (W): | None |
| Power Supply Details: | Shared |
| Disk Drive: | SATA DOM 128GB P/N DESSH-A28D09BCADCA |
| Disk Controller: | Integrated SATA controller |
| # and type of Network Interface Cards (NICs) Installed: | 1 x Intel I350 Gigabit Ethernet Controller |
| NICs Enabled in Firmware / OS / Connected: | 2/2/1 |
| Network Speed (Mbit): | 1000 |
| Keyboard: | None |
| Mouse: | None |
| Monitor: | None |
| Optical Drives: | No |
| Other Hardware: | None |
| Software | |
|---|---|
| Power Management: | Balanced Mode enabled in OS (see SUT Notes) |
| Operating System (OS): | Microsoft Windows Server 2012 R2 Datacenter |
| OS Version: | Version 6.3 (Build 9600) |
| Filesystem: | NTFS |
| JVM Vendor: | Oracle Corporation |
| JVM Version: | Java HotSpot(TM) 64-Bit Server VM (build 24.80-b11, mixed mode), version 1.7.0_80 |
| JVM Command-line Options: | -server -Xmn19g -Xms21g -Xmx21g -XX:SurvivorRatio=1 -XX:TargetSurvivorRatio=99 -XX:ParallelGCThreads=28 -XX:AllocatePrefetchDistance=256 -XX:AllocatePrefetchLines=4 -XX:LoopUnrollLimit=45 -XX:InitialTenuringThreshold=12 -XX:MaxTenuringThreshold=15 -XX:InlineSmallCode=9000 -XX:MaxInlineSize=270 -XX:FreqInlineSize=6000 -XX:+UseLargePages -XX:+UseParallelOldGC -XX:+AggressiveOpts |
| JVM Affinity: | start /NODE [0,2] /AFFINITY [0xFC0FF00FC0FF];start /NODE [1,3] /AFFINITY [0xFF03F00FF03F] |
| JVM Instances: | 4 |
| JVM Initial Heap (MB): | 21000 |
| JVM Maximum Heap (MB): | 21000 |
| JVM Address Bits: | 64 |
| Boot Firmware Version: | 2.00.25 |
| Management Firmware Version: | UIS-OM 1.00.10 |
| Workload Version: | SSJ 1.2.10 |
| Director Location: | Controller |
| Other Software: | Microsoft Windows KB3021910, clearcompressionflag.exe, KB2919355, KB2932046, KB2959977, KB2937592, KB2938439, KB2934018, KB4056898, patched to this test system in May 15, 2019 |
| JVM Instance | ssj_ops@100% |
|---|---|
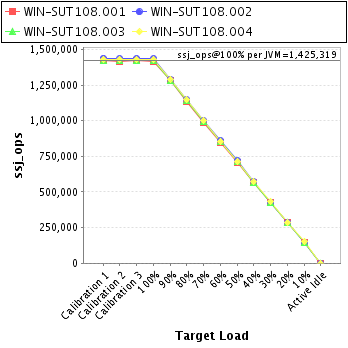
| WIN-SUT108.001 | 1,417,708 |
| WIN-SUT108.002 | 1,434,458 |
| WIN-SUT108.003 | 1,421,143 |
| WIN-SUT108.004 | 1,427,966 |
| ssj_ops@100% | 5,701,276 |
| ssj_ops@100% per JVM | 1,425,319 |
| Target Load | Actual Load | ssj_ops | |
|---|---|---|---|
| Target | Actual | ||
| Calibration 1 | 1,422,299 | ||
| Calibration 2 | 1,418,733 | ||
| Calibration 3 | 1,421,011 | ||
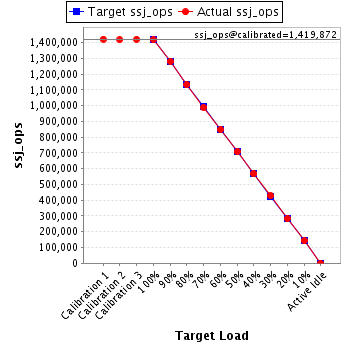
| ssj_ops@calibrated=1,419,872 | |||
| 100% | 99.8% | 1,419,872 | 1,417,708 |
| 90% | 90.3% | 1,277,885 | 1,281,457 |
| 80% | 79.8% | 1,135,897 | 1,133,232 |
| 70% | 69.7% | 993,910 | 989,216 |
| 60% | 59.8% | 851,923 | 848,616 |
| 50% | 49.9% | 709,936 | 707,958 |
| 40% | 40.0% | 567,949 | 567,794 |
| 30% | 30.1% | 425,962 | 427,474 |
| 20% | 19.9% | 283,974 | 282,677 |
| 10% | 10.1% | 141,987 | 143,069 |
| Active Idle | 0 | 0 | |
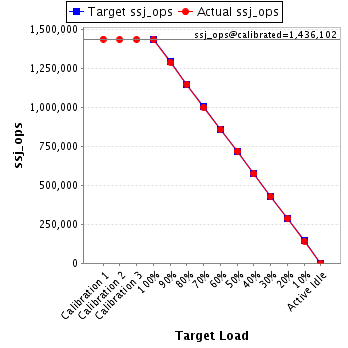
| Target Load | Actual Load | ssj_ops | |
|---|---|---|---|
| Target | Actual | ||
| Calibration 1 | 1,438,872 | ||
| Calibration 2 | 1,435,890 | ||
| Calibration 3 | 1,436,313 | ||
| ssj_ops@calibrated=1,436,102 | |||
| 100% | 99.9% | 1,436,102 | 1,434,458 |
| 90% | 89.9% | 1,292,492 | 1,291,657 |
| 80% | 80.0% | 1,148,882 | 1,148,591 |
| 70% | 69.8% | 1,005,271 | 1,001,786 |
| 60% | 59.9% | 861,661 | 859,691 |
| 50% | 50.2% | 718,051 | 720,230 |
| 40% | 40.0% | 574,441 | 573,919 |
| 30% | 29.9% | 430,831 | 429,428 |
| 20% | 20.0% | 287,220 | 287,011 |
| 10% | 9.9% | 143,610 | 142,781 |
| Active Idle | 0 | 0 | |
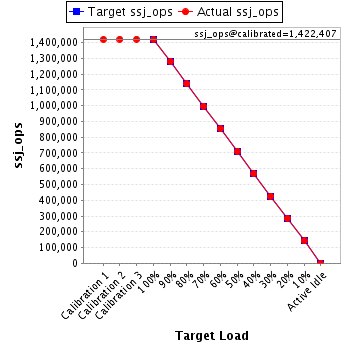
| Target Load | Actual Load | ssj_ops | |
|---|---|---|---|
| Target | Actual | ||
| Calibration 1 | 1,420,746 | ||
| Calibration 2 | 1,422,331 | ||
| Calibration 3 | 1,422,484 | ||
| ssj_ops@calibrated=1,422,407 | |||
| 100% | 99.9% | 1,422,407 | 1,421,143 |
| 90% | 90.0% | 1,280,167 | 1,280,660 |
| 80% | 80.1% | 1,137,926 | 1,139,404 |
| 70% | 70.1% | 995,685 | 997,471 |
| 60% | 60.0% | 853,444 | 853,617 |
| 50% | 50.0% | 711,204 | 711,603 |
| 40% | 40.0% | 568,963 | 568,862 |
| 30% | 30.0% | 426,722 | 426,303 |
| 20% | 20.1% | 284,481 | 285,725 |
| 10% | 10.0% | 142,241 | 142,307 |
| Active Idle | 0 | 0 | |
| Target Load | Actual Load | ssj_ops | |
|---|---|---|---|
| Target | Actual | ||
| Calibration 1 | 1,431,300 | ||
| Calibration 2 | 1,431,004 | ||
| Calibration 3 | 1,430,618 | ||
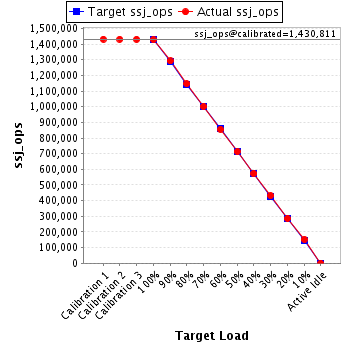
| ssj_ops@calibrated=1,430,811 | |||
| 100% | 99.8% | 1,430,811 | 1,427,966 |
| 90% | 90.3% | 1,287,730 | 1,292,188 |
| 80% | 80.1% | 1,144,649 | 1,146,749 |
| 70% | 70.0% | 1,001,568 | 1,001,706 |
| 60% | 59.8% | 858,486 | 855,552 |
| 50% | 49.8% | 715,405 | 713,163 |
| 40% | 40.0% | 572,324 | 572,258 |
| 30% | 30.2% | 429,243 | 432,092 |
| 20% | 20.0% | 286,162 | 285,996 |
| 10% | 10.7% | 143,081 | 152,911 |
| Active Idle | 0 | 0 | |