
SPECpower_ssj2008
Host 'WIN-SUT107' Performance Report
Copyright © 2007-2019 Standard Performance Evaluation Corporation
| New H3C Technologies Co., Ltd. H3C UniServer B5700 G3 | ssj_ops@100% = 5,683,547 ssj_ops@100% per JVM = 1,420,887 |
||||
| Test Sponsor: | New H3C Technologies Co., Ltd. | SPEC License #: | 9066 | Test Method: | Multi Node |
| Tested By: | New H3C Technologies Co., Ltd. | Test Location: | Hangzhou, Zhejiang, China | Test Date: | May 17, 2019 |
| Hardware Availability: | Jan-2019 | Software Availability: | Jan-2019 | Publication: | Jun 12, 2019 |
| System Source: | Single Supplier | System Designation: | Server | Power Provisioning: | Line-powered |
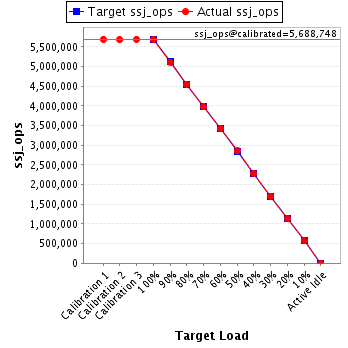
| Target Load | Actual Load | ssj_ops | |
|---|---|---|---|
| Target | Actual | ||
| Calibration 1 | 5,692,495 | ||
| Calibration 2 | 5,682,731 | ||
| Calibration 3 | 5,694,764 | ||
| ssj_ops@calibrated=5,688,748 | |||
| 100% | 99.9% | 5,688,748 | 5,683,547 |
| 90% | 89.9% | 5,119,873 | 5,114,413 |
| 80% | 80.0% | 4,550,998 | 4,553,436 |
| 70% | 70.0% | 3,982,124 | 3,981,912 |
| 60% | 60.1% | 3,413,249 | 3,417,889 |
| 50% | 50.2% | 2,844,374 | 2,853,896 |
| 40% | 40.0% | 2,275,499 | 2,275,129 |
| 30% | 30.0% | 1,706,624 | 1,704,169 |
| 20% | 20.0% | 1,137,750 | 1,139,632 |
| 10% | 10.0% | 568,875 | 569,435 |
| Active Idle | 0 | 0 | |
| Set Identifier: | sut |
| Set Description: | System Under Test |
| # of Identical Nodes: | 14 |
| Comment: | SUT |
| Hardware | |
|---|---|
| Hardware Vendor: | New H3C Technologies Co., Ltd. |
| Model: | H3C UniServer B5700 G3 |
| Form Factor: | Other |
| CPU Name: | Intel Xeon Platinum 8180 2.50GHz |
| CPU Characteristics: | 28-Core, 2.50 GHz, 38.5 MB L3 Cache |
| CPU Frequency (MHz): | 2500 |
| CPU(s) Enabled: | 56 cores, 2 chips, 28 cores/chip |
| Hardware Threads: | 112 (2 / core) |
| CPU(s) Orderable: | 1,2 chips |
| Primary Cache: | 32 KB I + 32 KB D on chip per core |
| Secondary Cache: | 1 MB I+D on chip per core |
| Tertiary Cache: | 39424 KB I+D on chip per chip |
| Other Cache: | None |
| Memory Amount (GB): | 192.0 |
| # and size of DIMM: | 12 x 16384 MB |
| Memory Details: | 12 x 16GB 2Rx8 PC4-2666-V ECC;slots A1, A2, A3, A4, A5, A6, B1, B2, B3, B4, B5, B6 populated |
| Power Supply Quantity and Rating (W): | None |
| Power Supply Details: | Shared |
| Disk Drive: | SATA DOM 128GB P/N DESSH-A28D09BCADCA |
| Disk Controller: | Integrated SATA controller |
| # and type of Network Interface Cards (NICs) Installed: | 1 x Intel I350 Gigabit Ethernet Controller |
| NICs Enabled in Firmware / OS / Connected: | 2/2/1 |
| Network Speed (Mbit): | 1000 |
| Keyboard: | None |
| Mouse: | None |
| Monitor: | None |
| Optical Drives: | No |
| Other Hardware: | None |
| Software | |
|---|---|
| Power Management: | Balanced Mode enabled in OS (see SUT Notes) |
| Operating System (OS): | Microsoft Windows Server 2012 R2 Datacenter |
| OS Version: | Version 6.3 (Build 9600) |
| Filesystem: | NTFS |
| JVM Vendor: | Oracle Corporation |
| JVM Version: | Java HotSpot(TM) 64-Bit Server VM (build 24.80-b11, mixed mode), version 1.7.0_80 |
| JVM Command-line Options: | -server -Xmn19g -Xms21g -Xmx21g -XX:SurvivorRatio=1 -XX:TargetSurvivorRatio=99 -XX:ParallelGCThreads=28 -XX:AllocatePrefetchDistance=256 -XX:AllocatePrefetchLines=4 -XX:LoopUnrollLimit=45 -XX:InitialTenuringThreshold=12 -XX:MaxTenuringThreshold=15 -XX:InlineSmallCode=9000 -XX:MaxInlineSize=270 -XX:FreqInlineSize=6000 -XX:+UseLargePages -XX:+UseParallelOldGC -XX:+AggressiveOpts |
| JVM Affinity: | start /NODE [0,2] /AFFINITY [0xFC0FF00FC0FF];start /NODE [1,3] /AFFINITY [0xFF03F00FF03F] |
| JVM Instances: | 4 |
| JVM Initial Heap (MB): | 21000 |
| JVM Maximum Heap (MB): | 21000 |
| JVM Address Bits: | 64 |
| Boot Firmware Version: | 2.00.25 |
| Management Firmware Version: | UIS-OM 1.00.10 |
| Workload Version: | SSJ 1.2.10 |
| Director Location: | Controller |
| Other Software: | Microsoft Windows KB3021910, clearcompressionflag.exe, KB2919355, KB2932046, KB2959977, KB2937592, KB2938439, KB2934018, KB4056898, patched to this test system in May 15, 2019 |
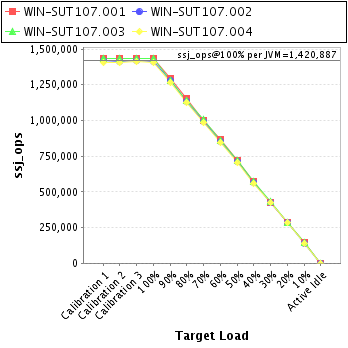
| JVM Instance | ssj_ops@100% |
|---|---|
| WIN-SUT107.001 | 1,433,836 |
| WIN-SUT107.002 | 1,413,378 |
| WIN-SUT107.003 | 1,431,049 |
| WIN-SUT107.004 | 1,405,284 |
| ssj_ops@100% | 5,683,547 |
| ssj_ops@100% per JVM | 1,420,887 |
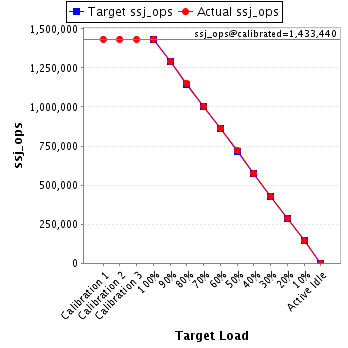
| Target Load | Actual Load | ssj_ops | |
|---|---|---|---|
| Target | Actual | ||
| Calibration 1 | 1,433,163 | ||
| Calibration 2 | 1,433,688 | ||
| Calibration 3 | 1,433,192 | ||
| ssj_ops@calibrated=1,433,440 | |||
| 100% | 100.0% | 1,433,440 | 1,433,836 |
| 90% | 90.1% | 1,290,096 | 1,290,942 |
| 80% | 80.4% | 1,146,752 | 1,152,032 |
| 70% | 69.9% | 1,003,408 | 1,002,274 |
| 60% | 60.2% | 860,064 | 863,278 |
| 50% | 50.3% | 716,720 | 720,547 |
| 40% | 40.1% | 573,376 | 575,158 |
| 30% | 29.9% | 430,032 | 428,270 |
| 20% | 19.9% | 286,688 | 285,721 |
| 10% | 10.0% | 143,344 | 143,101 |
| Active Idle | 0 | 0 | |
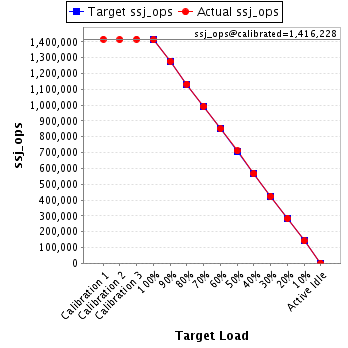
| Target Load | Actual Load | ssj_ops | |
|---|---|---|---|
| Target | Actual | ||
| Calibration 1 | 1,417,177 | ||
| Calibration 2 | 1,414,938 | ||
| Calibration 3 | 1,417,517 | ||
| ssj_ops@calibrated=1,416,228 | |||
| 100% | 99.8% | 1,416,228 | 1,413,378 |
| 90% | 90.2% | 1,274,605 | 1,277,470 |
| 80% | 80.0% | 1,132,982 | 1,132,869 |
| 70% | 70.1% | 991,359 | 993,371 |
| 60% | 60.1% | 849,737 | 850,561 |
| 50% | 50.2% | 708,114 | 710,372 |
| 40% | 40.0% | 566,491 | 566,104 |
| 30% | 29.9% | 424,868 | 423,585 |
| 20% | 20.0% | 283,246 | 283,761 |
| 10% | 10.0% | 141,623 | 141,517 |
| Active Idle | 0 | 0 | |
| Target Load | Actual Load | ssj_ops | |
|---|---|---|---|
| Target | Actual | ||
| Calibration 1 | 1,435,827 | ||
| Calibration 2 | 1,430,246 | ||
| Calibration 3 | 1,432,446 | ||
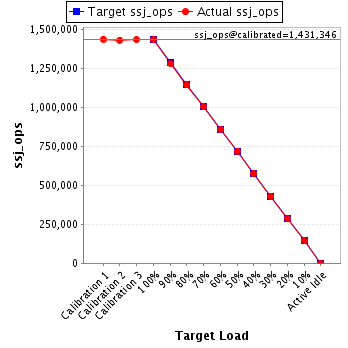
| ssj_ops@calibrated=1,431,346 | |||
| 100% | 100.0% | 1,431,346 | 1,431,049 |
| 90% | 89.4% | 1,288,211 | 1,279,237 |
| 80% | 79.8% | 1,145,077 | 1,142,171 |
| 70% | 70.1% | 1,001,942 | 1,003,275 |
| 60% | 60.0% | 858,808 | 858,378 |
| 50% | 50.2% | 715,673 | 719,047 |
| 40% | 40.0% | 572,538 | 572,924 |
| 30% | 30.0% | 429,404 | 429,225 |
| 20% | 20.0% | 286,269 | 286,767 |
| 10% | 10.1% | 143,135 | 143,855 |
| Active Idle | 0 | 0 | |
| Target Load | Actual Load | ssj_ops | |
|---|---|---|---|
| Target | Actual | ||
| Calibration 1 | 1,406,328 | ||
| Calibration 2 | 1,403,860 | ||
| Calibration 3 | 1,411,609 | ||
| ssj_ops@calibrated=1,407,734 | |||
| 100% | 99.8% | 1,407,734 | 1,405,284 |
| 90% | 90.0% | 1,266,961 | 1,266,765 |
| 80% | 80.0% | 1,126,187 | 1,126,364 |
| 70% | 69.8% | 985,414 | 982,993 |
| 60% | 60.1% | 844,641 | 845,672 |
| 50% | 50.0% | 703,867 | 703,930 |
| 40% | 39.8% | 563,094 | 560,943 |
| 30% | 30.1% | 422,320 | 423,089 |
| 20% | 20.1% | 281,547 | 283,383 |
| 10% | 10.0% | 140,773 | 140,962 |
| Active Idle | 0 | 0 | |
