SPECpower_ssj2008
Host 'WIN-SUT106' Performance Report
Copyright © 2007-2019 Standard Performance Evaluation Corporation
| New H3C Technologies Co., Ltd. H3C UniServer B5700 G3 | ssj_ops@100% = 5,693,247 ssj_ops@100% per JVM = 1,423,312 |
||||
| Test Sponsor: | New H3C Technologies Co., Ltd. | SPEC License #: | 9066 | Test Method: | Multi Node |
| Tested By: | New H3C Technologies Co., Ltd. | Test Location: | Hangzhou, Zhejiang, China | Test Date: | May 17, 2019 |
| Hardware Availability: | Jan-2019 | Software Availability: | Jan-2019 | Publication: | Jun 12, 2019 |
| System Source: | Single Supplier | System Designation: | Server | Power Provisioning: | Line-powered |
| Target Load | Actual Load | ssj_ops | |
|---|---|---|---|
| Target | Actual | ||
| Calibration 1 | 5,704,659 | ||
| Calibration 2 | 5,694,556 | ||
| Calibration 3 | 5,707,149 | ||
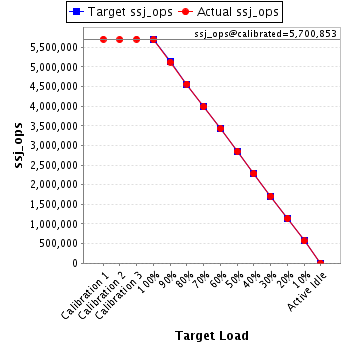
| ssj_ops@calibrated=5,700,853 | |||
| 100% | 99.9% | 5,700,853 | 5,693,247 |
| 90% | 89.8% | 5,130,767 | 5,121,338 |
| 80% | 80.1% | 4,560,682 | 4,564,309 |
| 70% | 69.9% | 3,990,597 | 3,985,586 |
| 60% | 60.2% | 3,420,512 | 3,430,328 |
| 50% | 50.0% | 2,850,426 | 2,848,636 |
| 40% | 40.0% | 2,280,341 | 2,279,117 |
| 30% | 30.0% | 1,710,256 | 1,712,355 |
| 20% | 20.1% | 1,140,171 | 1,143,958 |
| 10% | 10.0% | 570,085 | 568,521 |
| Active Idle | 0 | 0 | |
| Set Identifier: | sut |
| Set Description: | System Under Test |
| # of Identical Nodes: | 14 |
| Comment: | SUT |
| Hardware | |
|---|---|
| Hardware Vendor: | New H3C Technologies Co., Ltd. |
| Model: | H3C UniServer B5700 G3 |
| Form Factor: | Other |
| CPU Name: | Intel Xeon Platinum 8180 2.50GHz |
| CPU Characteristics: | 28-Core, 2.50 GHz, 38.5 MB L3 Cache |
| CPU Frequency (MHz): | 2500 |
| CPU(s) Enabled: | 56 cores, 2 chips, 28 cores/chip |
| Hardware Threads: | 112 (2 / core) |
| CPU(s) Orderable: | 1,2 chips |
| Primary Cache: | 32 KB I + 32 KB D on chip per core |
| Secondary Cache: | 1 MB I+D on chip per core |
| Tertiary Cache: | 39424 KB I+D on chip per chip |
| Other Cache: | None |
| Memory Amount (GB): | 192.0 |
| # and size of DIMM: | 12 x 16384 MB |
| Memory Details: | 12 x 16GB 2Rx8 PC4-2666-V ECC;slots A1, A2, A3, A4, A5, A6, B1, B2, B3, B4, B5, B6 populated |
| Power Supply Quantity and Rating (W): | None |
| Power Supply Details: | Shared |
| Disk Drive: | SATA DOM 128GB P/N DESSH-A28D09BCADCA |
| Disk Controller: | Integrated SATA controller |
| # and type of Network Interface Cards (NICs) Installed: | 1 x Intel I350 Gigabit Ethernet Controller |
| NICs Enabled in Firmware / OS / Connected: | 2/2/1 |
| Network Speed (Mbit): | 1000 |
| Keyboard: | None |
| Mouse: | None |
| Monitor: | None |
| Optical Drives: | No |
| Other Hardware: | None |
| Software | |
|---|---|
| Power Management: | Balanced Mode enabled in OS (see SUT Notes) |
| Operating System (OS): | Microsoft Windows Server 2012 R2 Datacenter |
| OS Version: | Version 6.3 (Build 9600) |
| Filesystem: | NTFS |
| JVM Vendor: | Oracle Corporation |
| JVM Version: | Java HotSpot(TM) 64-Bit Server VM (build 24.80-b11, mixed mode), version 1.7.0_80 |
| JVM Command-line Options: | -server -Xmn19g -Xms21g -Xmx21g -XX:SurvivorRatio=1 -XX:TargetSurvivorRatio=99 -XX:ParallelGCThreads=28 -XX:AllocatePrefetchDistance=256 -XX:AllocatePrefetchLines=4 -XX:LoopUnrollLimit=45 -XX:InitialTenuringThreshold=12 -XX:MaxTenuringThreshold=15 -XX:InlineSmallCode=9000 -XX:MaxInlineSize=270 -XX:FreqInlineSize=6000 -XX:+UseLargePages -XX:+UseParallelOldGC -XX:+AggressiveOpts |
| JVM Affinity: | start /NODE [0,2] /AFFINITY [0xFC0FF00FC0FF];start /NODE [1,3] /AFFINITY [0xFF03F00FF03F] |
| JVM Instances: | 4 |
| JVM Initial Heap (MB): | 21000 |
| JVM Maximum Heap (MB): | 21000 |
| JVM Address Bits: | 64 |
| Boot Firmware Version: | 2.00.25 |
| Management Firmware Version: | UIS-OM 1.00.10 |
| Workload Version: | SSJ 1.2.10 |
| Director Location: | Controller |
| Other Software: | Microsoft Windows KB3021910, clearcompressionflag.exe, KB2919355, KB2932046, KB2959977, KB2937592, KB2938439, KB2934018, KB4056898, patched to this test system in May 15, 2019 |
| JVM Instance | ssj_ops@100% |
|---|---|
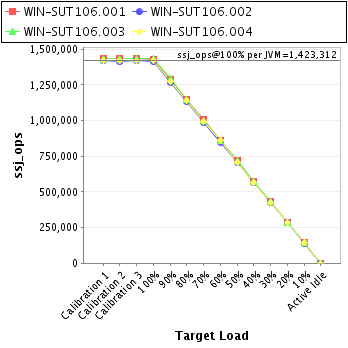
| WIN-SUT106.001 | 1,429,196 |
| WIN-SUT106.002 | 1,411,561 |
| WIN-SUT106.003 | 1,431,314 |
| WIN-SUT106.004 | 1,421,176 |
| ssj_ops@100% | 5,693,247 |
| ssj_ops@100% per JVM | 1,423,312 |
| Target Load | Actual Load | ssj_ops | |
|---|---|---|---|
| Target | Actual | ||
| Calibration 1 | 1,436,601 | ||
| Calibration 2 | 1,434,078 | ||
| Calibration 3 | 1,432,167 | ||
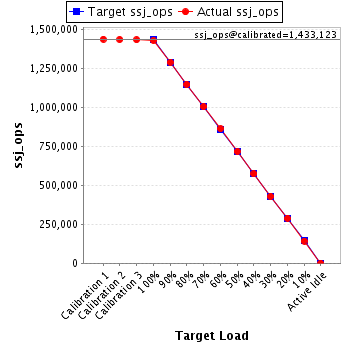
| ssj_ops@calibrated=1,433,123 | |||
| 100% | 99.7% | 1,433,123 | 1,429,196 |
| 90% | 90.0% | 1,289,810 | 1,289,233 |
| 80% | 80.0% | 1,146,498 | 1,147,182 |
| 70% | 70.0% | 1,003,186 | 1,003,769 |
| 60% | 60.2% | 859,874 | 862,670 |
| 50% | 50.0% | 716,561 | 716,846 |
| 40% | 40.0% | 573,249 | 572,745 |
| 30% | 29.9% | 429,937 | 429,165 |
| 20% | 20.2% | 286,625 | 288,983 |
| 10% | 9.9% | 143,312 | 142,595 |
| Active Idle | 0 | 0 | |
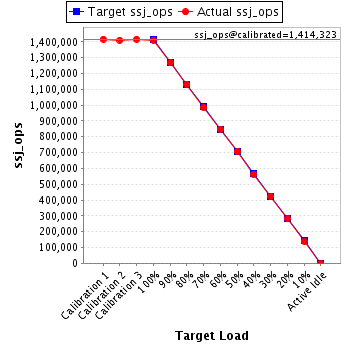
| Target Load | Actual Load | ssj_ops | |
|---|---|---|---|
| Target | Actual | ||
| Calibration 1 | 1,417,428 | ||
| Calibration 2 | 1,411,279 | ||
| Calibration 3 | 1,417,368 | ||
| ssj_ops@calibrated=1,414,323 | |||
| 100% | 99.8% | 1,414,323 | 1,411,561 |
| 90% | 89.6% | 1,272,891 | 1,267,195 |
| 80% | 80.1% | 1,131,459 | 1,132,595 |
| 70% | 69.8% | 990,026 | 986,935 |
| 60% | 60.0% | 848,594 | 849,065 |
| 50% | 49.9% | 707,162 | 705,937 |
| 40% | 39.9% | 565,729 | 564,576 |
| 30% | 30.0% | 424,297 | 424,142 |
| 20% | 20.0% | 282,865 | 282,767 |
| 10% | 9.9% | 141,432 | 140,280 |
| Active Idle | 0 | 0 | |
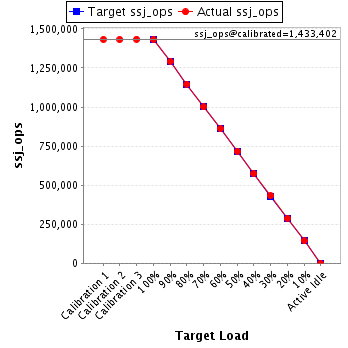
| Target Load | Actual Load | ssj_ops | |
|---|---|---|---|
| Target | Actual | ||
| Calibration 1 | 1,432,312 | ||
| Calibration 2 | 1,432,275 | ||
| Calibration 3 | 1,434,529 | ||
| ssj_ops@calibrated=1,433,402 | |||
| 100% | 99.9% | 1,433,402 | 1,431,314 |
| 90% | 90.2% | 1,290,062 | 1,292,374 |
| 80% | 80.0% | 1,146,722 | 1,146,734 |
| 70% | 69.8% | 1,003,382 | 1,000,511 |
| 60% | 60.1% | 860,041 | 861,236 |
| 50% | 50.0% | 716,701 | 716,840 |
| 40% | 40.0% | 573,361 | 573,038 |
| 30% | 30.1% | 430,021 | 431,085 |
| 20% | 20.0% | 286,680 | 287,068 |
| 10% | 10.0% | 143,340 | 143,302 |
| Active Idle | 0 | 0 | |
| Target Load | Actual Load | ssj_ops | |
|---|---|---|---|
| Target | Actual | ||
| Calibration 1 | 1,418,318 | ||
| Calibration 2 | 1,416,923 | ||
| Calibration 3 | 1,423,086 | ||
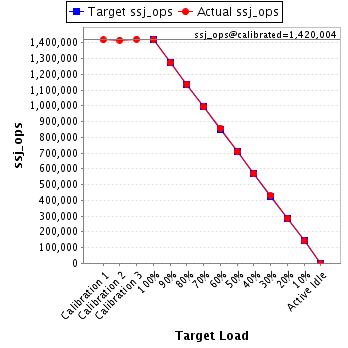
| ssj_ops@calibrated=1,420,004 | |||
| 100% | 100.1% | 1,420,004 | 1,421,176 |
| 90% | 89.6% | 1,278,004 | 1,272,536 |
| 80% | 80.1% | 1,136,004 | 1,137,797 |
| 70% | 70.0% | 994,003 | 994,371 |
| 60% | 60.4% | 852,003 | 857,357 |
| 50% | 49.9% | 710,002 | 709,014 |
| 40% | 40.1% | 568,002 | 568,758 |
| 30% | 30.1% | 426,001 | 427,963 |
| 20% | 20.1% | 284,001 | 285,140 |
| 10% | 10.0% | 142,000 | 142,344 |
| Active Idle | 0 | 0 | |