SPECpower_ssj2008
Host 'WIN-SUT105' Performance Report
Copyright © 2007-2019 Standard Performance Evaluation Corporation
| New H3C Technologies Co., Ltd. H3C UniServer B5700 G3 | ssj_ops@100% = 5,707,398 ssj_ops@100% per JVM = 1,426,850 |
||||
| Test Sponsor: | New H3C Technologies Co., Ltd. | SPEC License #: | 9066 | Test Method: | Multi Node |
| Tested By: | New H3C Technologies Co., Ltd. | Test Location: | Hangzhou, Zhejiang, China | Test Date: | May 17, 2019 |
| Hardware Availability: | Jan-2019 | Software Availability: | Jan-2019 | Publication: | Jun 12, 2019 |
| System Source: | Single Supplier | System Designation: | Server | Power Provisioning: | Line-powered |
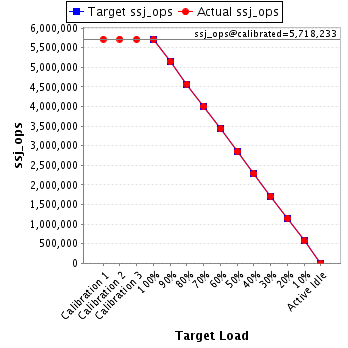
| Target Load | Actual Load | ssj_ops | |
|---|---|---|---|
| Target | Actual | ||
| Calibration 1 | 5,717,549 | ||
| Calibration 2 | 5,719,762 | ||
| Calibration 3 | 5,716,704 | ||
| ssj_ops@calibrated=5,718,233 | |||
| 100% | 99.8% | 5,718,233 | 5,707,398 |
| 90% | 89.9% | 5,146,410 | 5,142,624 |
| 80% | 80.0% | 4,574,586 | 4,575,332 |
| 70% | 70.1% | 4,002,763 | 4,011,301 |
| 60% | 59.9% | 3,430,940 | 3,427,432 |
| 50% | 49.9% | 2,859,116 | 2,855,101 |
| 40% | 40.0% | 2,287,293 | 2,285,977 |
| 30% | 30.0% | 1,715,470 | 1,714,680 |
| 20% | 20.0% | 1,143,647 | 1,145,635 |
| 10% | 10.0% | 571,823 | 570,193 |
| Active Idle | 0 | 0 | |
| Set Identifier: | sut |
| Set Description: | System Under Test |
| # of Identical Nodes: | 14 |
| Comment: | SUT |
| Hardware | |
|---|---|
| Hardware Vendor: | New H3C Technologies Co., Ltd. |
| Model: | H3C UniServer B5700 G3 |
| Form Factor: | Other |
| CPU Name: | Intel Xeon Platinum 8180 2.50GHz |
| CPU Characteristics: | 28-Core, 2.50 GHz, 38.5 MB L3 Cache |
| CPU Frequency (MHz): | 2500 |
| CPU(s) Enabled: | 56 cores, 2 chips, 28 cores/chip |
| Hardware Threads: | 112 (2 / core) |
| CPU(s) Orderable: | 1,2 chips |
| Primary Cache: | 32 KB I + 32 KB D on chip per core |
| Secondary Cache: | 1 MB I+D on chip per core |
| Tertiary Cache: | 39424 KB I+D on chip per chip |
| Other Cache: | None |
| Memory Amount (GB): | 192.0 |
| # and size of DIMM: | 12 x 16384 MB |
| Memory Details: | 12 x 16GB 2Rx8 PC4-2666-V ECC;slots A1, A2, A3, A4, A5, A6, B1, B2, B3, B4, B5, B6 populated |
| Power Supply Quantity and Rating (W): | None |
| Power Supply Details: | Shared |
| Disk Drive: | SATA DOM 128GB P/N DESSH-A28D09BCADCA |
| Disk Controller: | Integrated SATA controller |
| # and type of Network Interface Cards (NICs) Installed: | 1 x Intel I350 Gigabit Ethernet Controller |
| NICs Enabled in Firmware / OS / Connected: | 2/2/1 |
| Network Speed (Mbit): | 1000 |
| Keyboard: | None |
| Mouse: | None |
| Monitor: | None |
| Optical Drives: | No |
| Other Hardware: | None |
| Software | |
|---|---|
| Power Management: | Balanced Mode enabled in OS (see SUT Notes) |
| Operating System (OS): | Microsoft Windows Server 2012 R2 Datacenter |
| OS Version: | Version 6.3 (Build 9600) |
| Filesystem: | NTFS |
| JVM Vendor: | Oracle Corporation |
| JVM Version: | Java HotSpot(TM) 64-Bit Server VM (build 24.80-b11, mixed mode), version 1.7.0_80 |
| JVM Command-line Options: | -server -Xmn19g -Xms21g -Xmx21g -XX:SurvivorRatio=1 -XX:TargetSurvivorRatio=99 -XX:ParallelGCThreads=28 -XX:AllocatePrefetchDistance=256 -XX:AllocatePrefetchLines=4 -XX:LoopUnrollLimit=45 -XX:InitialTenuringThreshold=12 -XX:MaxTenuringThreshold=15 -XX:InlineSmallCode=9000 -XX:MaxInlineSize=270 -XX:FreqInlineSize=6000 -XX:+UseLargePages -XX:+UseParallelOldGC -XX:+AggressiveOpts |
| JVM Affinity: | start /NODE [0,2] /AFFINITY [0xFC0FF00FC0FF];start /NODE [1,3] /AFFINITY [0xFF03F00FF03F] |
| JVM Instances: | 4 |
| JVM Initial Heap (MB): | 21000 |
| JVM Maximum Heap (MB): | 21000 |
| JVM Address Bits: | 64 |
| Boot Firmware Version: | 2.00.25 |
| Management Firmware Version: | UIS-OM 1.00.10 |
| Workload Version: | SSJ 1.2.10 |
| Director Location: | Controller |
| Other Software: | Microsoft Windows KB3021910, clearcompressionflag.exe, KB2919355, KB2932046, KB2959977, KB2937592, KB2938439, KB2934018, KB4056898, patched to this test system in May 15, 2019 |
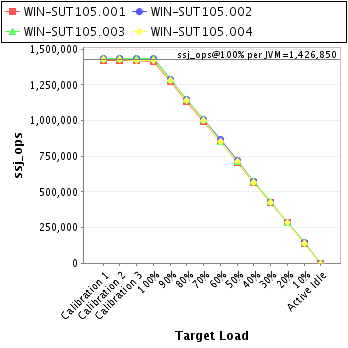
| JVM Instance | ssj_ops@100% |
|---|---|
| WIN-SUT105.001 | 1,415,738 |
| WIN-SUT105.002 | 1,434,722 |
| WIN-SUT105.003 | 1,432,799 |
| WIN-SUT105.004 | 1,424,139 |
| ssj_ops@100% | 5,707,398 |
| ssj_ops@100% per JVM | 1,426,850 |
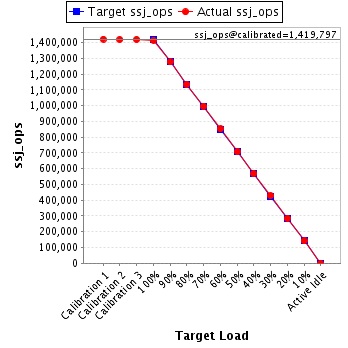
| Target Load | Actual Load | ssj_ops | |
|---|---|---|---|
| Target | Actual | ||
| Calibration 1 | 1,421,956 | ||
| Calibration 2 | 1,419,553 | ||
| Calibration 3 | 1,420,041 | ||
| ssj_ops@calibrated=1,419,797 | |||
| 100% | 99.7% | 1,419,797 | 1,415,738 |
| 90% | 90.0% | 1,277,817 | 1,277,304 |
| 80% | 80.0% | 1,135,838 | 1,135,632 |
| 70% | 70.2% | 993,858 | 996,981 |
| 60% | 60.0% | 851,878 | 852,079 |
| 50% | 49.9% | 709,899 | 708,181 |
| 40% | 40.1% | 567,919 | 568,634 |
| 30% | 30.1% | 425,939 | 428,028 |
| 20% | 20.0% | 283,959 | 284,336 |
| 10% | 10.0% | 141,980 | 141,565 |
| Active Idle | 0 | 0 | |
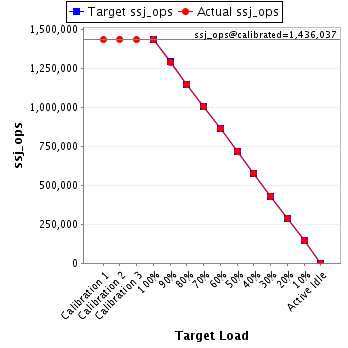
| Target Load | Actual Load | ssj_ops | |
|---|---|---|---|
| Target | Actual | ||
| Calibration 1 | 1,433,932 | ||
| Calibration 2 | 1,438,002 | ||
| Calibration 3 | 1,434,072 | ||
| ssj_ops@calibrated=1,436,037 | |||
| 100% | 99.9% | 1,436,037 | 1,434,722 |
| 90% | 89.9% | 1,292,433 | 1,291,359 |
| 80% | 80.0% | 1,148,830 | 1,149,475 |
| 70% | 70.0% | 1,005,226 | 1,005,178 |
| 60% | 60.2% | 861,622 | 864,359 |
| 50% | 50.0% | 718,018 | 717,813 |
| 40% | 40.1% | 574,415 | 575,231 |
| 30% | 29.9% | 430,811 | 429,524 |
| 20% | 20.0% | 287,207 | 286,850 |
| 10% | 10.0% | 143,604 | 144,213 |
| Active Idle | 0 | 0 | |
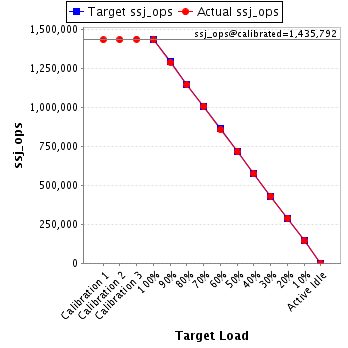
| Target Load | Actual Load | ssj_ops | |
|---|---|---|---|
| Target | Actual | ||
| Calibration 1 | 1,433,183 | ||
| Calibration 2 | 1,434,209 | ||
| Calibration 3 | 1,437,374 | ||
| ssj_ops@calibrated=1,435,792 | |||
| 100% | 99.8% | 1,435,792 | 1,432,799 |
| 90% | 89.8% | 1,292,213 | 1,289,388 |
| 80% | 79.8% | 1,148,633 | 1,145,672 |
| 70% | 70.2% | 1,005,054 | 1,007,797 |
| 60% | 59.7% | 861,475 | 857,104 |
| 50% | 49.9% | 717,896 | 716,936 |
| 40% | 39.9% | 574,317 | 573,424 |
| 30% | 30.0% | 430,738 | 430,614 |
| 20% | 20.1% | 287,158 | 288,270 |
| 10% | 10.0% | 143,579 | 143,422 |
| Active Idle | 0 | 0 | |
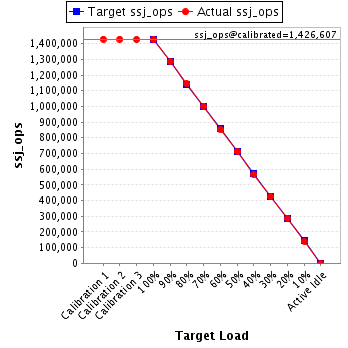
| Target Load | Actual Load | ssj_ops | |
|---|---|---|---|
| Target | Actual | ||
| Calibration 1 | 1,428,479 | ||
| Calibration 2 | 1,427,997 | ||
| Calibration 3 | 1,425,217 | ||
| ssj_ops@calibrated=1,426,607 | |||
| 100% | 99.8% | 1,426,607 | 1,424,139 |
| 90% | 90.0% | 1,283,946 | 1,284,573 |
| 80% | 80.2% | 1,141,286 | 1,144,553 |
| 70% | 70.2% | 998,625 | 1,001,344 |
| 60% | 59.9% | 855,964 | 853,890 |
| 50% | 49.9% | 713,304 | 712,170 |
| 40% | 39.9% | 570,643 | 568,689 |
| 30% | 29.9% | 427,982 | 426,514 |
| 20% | 20.1% | 285,321 | 286,179 |
| 10% | 9.9% | 142,661 | 140,993 |
| Active Idle | 0 | 0 | |