SPECpower_ssj2008
Host 'WIN-SUT104' Performance Report
Copyright © 2007-2019 Standard Performance Evaluation Corporation
| New H3C Technologies Co., Ltd. H3C UniServer B5700 G3 | ssj_ops@100% = 5,727,838 ssj_ops@100% per JVM = 1,431,960 |
||||
| Test Sponsor: | New H3C Technologies Co., Ltd. | SPEC License #: | 9066 | Test Method: | Multi Node |
| Tested By: | New H3C Technologies Co., Ltd. | Test Location: | Hangzhou, Zhejiang, China | Test Date: | May 17, 2019 |
| Hardware Availability: | Jan-2019 | Software Availability: | Jan-2019 | Publication: | Jun 12, 2019 |
| System Source: | Single Supplier | System Designation: | Server | Power Provisioning: | Line-powered |
| Target Load | Actual Load | ssj_ops | |
|---|---|---|---|
| Target | Actual | ||
| Calibration 1 | 5,732,296 | ||
| Calibration 2 | 5,728,708 | ||
| Calibration 3 | 5,741,897 | ||
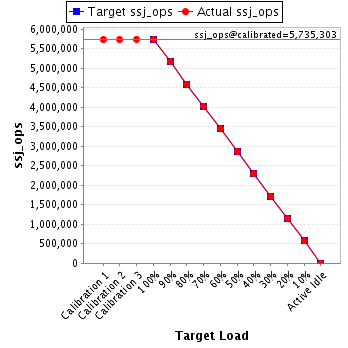
| ssj_ops@calibrated=5,735,303 | |||
| 100% | 99.9% | 5,735,303 | 5,727,838 |
| 90% | 90.0% | 5,161,772 | 5,163,268 |
| 80% | 80.1% | 4,588,242 | 4,592,967 |
| 70% | 70.0% | 4,014,712 | 4,016,457 |
| 60% | 60.1% | 3,441,182 | 3,447,188 |
| 50% | 50.0% | 2,867,651 | 2,867,058 |
| 40% | 40.0% | 2,294,121 | 2,291,587 |
| 30% | 30.0% | 1,720,591 | 1,721,322 |
| 20% | 20.0% | 1,147,061 | 1,148,405 |
| 10% | 10.0% | 573,530 | 571,715 |
| Active Idle | 0 | 0 | |
| Set Identifier: | sut |
| Set Description: | System Under Test |
| # of Identical Nodes: | 14 |
| Comment: | SUT |
| Hardware | |
|---|---|
| Hardware Vendor: | New H3C Technologies Co., Ltd. |
| Model: | H3C UniServer B5700 G3 |
| Form Factor: | Other |
| CPU Name: | Intel Xeon Platinum 8180 2.50GHz |
| CPU Characteristics: | 28-Core, 2.50 GHz, 38.5 MB L3 Cache |
| CPU Frequency (MHz): | 2500 |
| CPU(s) Enabled: | 56 cores, 2 chips, 28 cores/chip |
| Hardware Threads: | 112 (2 / core) |
| CPU(s) Orderable: | 1,2 chips |
| Primary Cache: | 32 KB I + 32 KB D on chip per core |
| Secondary Cache: | 1 MB I+D on chip per core |
| Tertiary Cache: | 39424 KB I+D on chip per chip |
| Other Cache: | None |
| Memory Amount (GB): | 192.0 |
| # and size of DIMM: | 12 x 16384 MB |
| Memory Details: | 12 x 16GB 2Rx8 PC4-2666-V ECC;slots A1, A2, A3, A4, A5, A6, B1, B2, B3, B4, B5, B6 populated |
| Power Supply Quantity and Rating (W): | None |
| Power Supply Details: | Shared |
| Disk Drive: | SATA DOM 128GB P/N DESSH-A28D09BCADCA |
| Disk Controller: | Integrated SATA controller |
| # and type of Network Interface Cards (NICs) Installed: | 1 x Intel I350 Gigabit Ethernet Controller |
| NICs Enabled in Firmware / OS / Connected: | 2/2/1 |
| Network Speed (Mbit): | 1000 |
| Keyboard: | None |
| Mouse: | None |
| Monitor: | None |
| Optical Drives: | No |
| Other Hardware: | None |
| Software | |
|---|---|
| Power Management: | Balanced Mode enabled in OS (see SUT Notes) |
| Operating System (OS): | Microsoft Windows Server 2012 R2 Datacenter |
| OS Version: | Version 6.3 (Build 9600) |
| Filesystem: | NTFS |
| JVM Vendor: | Oracle Corporation |
| JVM Version: | Java HotSpot(TM) 64-Bit Server VM (build 24.80-b11, mixed mode), version 1.7.0_80 |
| JVM Command-line Options: | -server -Xmn19g -Xms21g -Xmx21g -XX:SurvivorRatio=1 -XX:TargetSurvivorRatio=99 -XX:ParallelGCThreads=28 -XX:AllocatePrefetchDistance=256 -XX:AllocatePrefetchLines=4 -XX:LoopUnrollLimit=45 -XX:InitialTenuringThreshold=12 -XX:MaxTenuringThreshold=15 -XX:InlineSmallCode=9000 -XX:MaxInlineSize=270 -XX:FreqInlineSize=6000 -XX:+UseLargePages -XX:+UseParallelOldGC -XX:+AggressiveOpts |
| JVM Affinity: | start /NODE [0,2] /AFFINITY [0xFC0FF00FC0FF];start /NODE [1,3] /AFFINITY [0xFF03F00FF03F] |
| JVM Instances: | 4 |
| JVM Initial Heap (MB): | 21000 |
| JVM Maximum Heap (MB): | 21000 |
| JVM Address Bits: | 64 |
| Boot Firmware Version: | 2.00.25 |
| Management Firmware Version: | UIS-OM 1.00.10 |
| Workload Version: | SSJ 1.2.10 |
| Director Location: | Controller |
| Other Software: | Microsoft Windows KB3021910, clearcompressionflag.exe, KB2919355, KB2932046, KB2959977, KB2937592, KB2938439, KB2934018, KB4056898, patched to this test system in May 15, 2019 |
| JVM Instance | ssj_ops@100% |
|---|---|
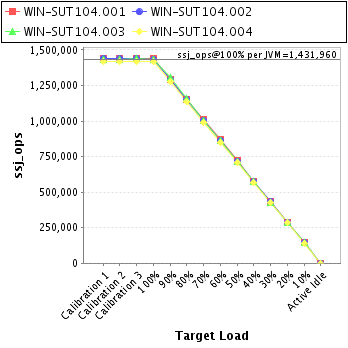
| WIN-SUT104.001 | 1,440,298 |
| WIN-SUT104.002 | 1,434,740 |
| WIN-SUT104.003 | 1,434,259 |
| WIN-SUT104.004 | 1,418,541 |
| ssj_ops@100% | 5,727,838 |
| ssj_ops@100% per JVM | 1,431,960 |
| Target Load | Actual Load | ssj_ops | |
|---|---|---|---|
| Target | Actual | ||
| Calibration 1 | 1,439,928 | ||
| Calibration 2 | 1,439,859 | ||
| Calibration 3 | 1,442,303 | ||
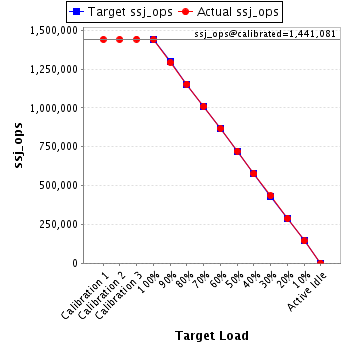
| ssj_ops@calibrated=1,441,081 | |||
| 100% | 99.9% | 1,441,081 | 1,440,298 |
| 90% | 89.7% | 1,296,973 | 1,292,344 |
| 80% | 80.0% | 1,152,865 | 1,153,277 |
| 70% | 70.1% | 1,008,757 | 1,010,455 |
| 60% | 60.2% | 864,649 | 867,641 |
| 50% | 50.1% | 720,541 | 721,649 |
| 40% | 39.9% | 576,433 | 575,084 |
| 30% | 30.1% | 432,324 | 433,627 |
| 20% | 20.0% | 288,216 | 288,713 |
| 10% | 10.0% | 144,108 | 143,747 |
| Active Idle | 0 | 0 | |
| Target Load | Actual Load | ssj_ops | |
|---|---|---|---|
| Target | Actual | ||
| Calibration 1 | 1,439,898 | ||
| Calibration 2 | 1,436,900 | ||
| Calibration 3 | 1,439,857 | ||
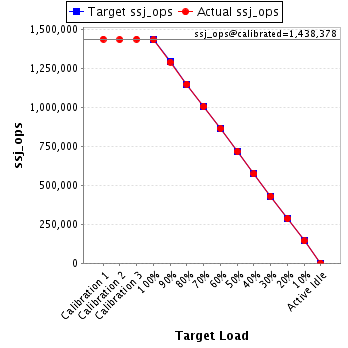
| ssj_ops@calibrated=1,438,378 | |||
| 100% | 99.7% | 1,438,378 | 1,434,740 |
| 90% | 89.9% | 1,294,541 | 1,292,585 |
| 80% | 80.0% | 1,150,703 | 1,150,066 |
| 70% | 70.0% | 1,006,865 | 1,006,929 |
| 60% | 60.1% | 863,027 | 864,801 |
| 50% | 49.9% | 719,189 | 718,310 |
| 40% | 39.9% | 575,351 | 573,646 |
| 30% | 30.0% | 431,514 | 431,720 |
| 20% | 20.0% | 287,676 | 287,047 |
| 10% | 10.0% | 143,838 | 143,636 |
| Active Idle | 0 | 0 | |
| Target Load | Actual Load | ssj_ops | |
|---|---|---|---|
| Target | Actual | ||
| Calibration 1 | 1,433,043 | ||
| Calibration 2 | 1,433,440 | ||
| Calibration 3 | 1,438,707 | ||
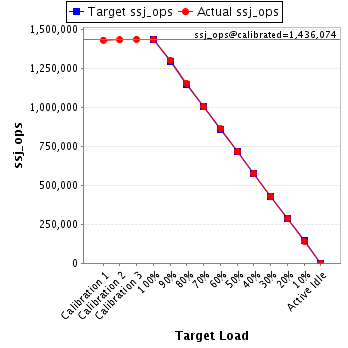
| ssj_ops@calibrated=1,436,074 | |||
| 100% | 99.9% | 1,436,074 | 1,434,259 |
| 90% | 90.7% | 1,292,466 | 1,302,966 |
| 80% | 80.4% | 1,148,859 | 1,155,306 |
| 70% | 70.1% | 1,005,252 | 1,006,409 |
| 60% | 60.1% | 861,644 | 863,286 |
| 50% | 49.9% | 718,037 | 716,642 |
| 40% | 40.1% | 574,429 | 576,271 |
| 30% | 30.0% | 430,822 | 430,841 |
| 20% | 20.1% | 287,215 | 288,153 |
| 10% | 9.9% | 143,607 | 142,525 |
| Active Idle | 0 | 0 | |
| Target Load | Actual Load | ssj_ops | |
|---|---|---|---|
| Target | Actual | ||
| Calibration 1 | 1,419,427 | ||
| Calibration 2 | 1,418,508 | ||
| Calibration 3 | 1,421,030 | ||
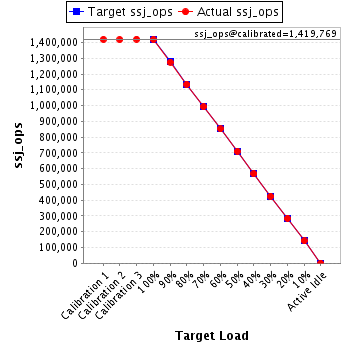
| ssj_ops@calibrated=1,419,769 | |||
| 100% | 99.9% | 1,419,769 | 1,418,541 |
| 90% | 89.8% | 1,277,792 | 1,275,373 |
| 80% | 79.9% | 1,135,815 | 1,134,319 |
| 70% | 69.9% | 993,838 | 992,664 |
| 60% | 60.0% | 851,862 | 851,461 |
| 50% | 50.0% | 709,885 | 710,457 |
| 40% | 39.9% | 567,908 | 566,586 |
| 30% | 29.9% | 425,931 | 425,134 |
| 20% | 20.0% | 283,954 | 284,492 |
| 10% | 10.0% | 141,977 | 141,808 |
| Active Idle | 0 | 0 | |