SPECpower_ssj2008
Host 'WIN-SUT101' Performance Report
Copyright © 2007-2019 Standard Performance Evaluation Corporation
| New H3C Technologies Co., Ltd. H3C UniServer B5700 G3 | ssj_ops@100% = 5,691,572 ssj_ops@100% per JVM = 1,422,893 |
||||
| Test Sponsor: | New H3C Technologies Co., Ltd. | SPEC License #: | 9066 | Test Method: | Multi Node |
| Tested By: | New H3C Technologies Co., Ltd. | Test Location: | Hangzhou, Zhejiang, China | Test Date: | May 17, 2019 |
| Hardware Availability: | Jan-2019 | Software Availability: | Jan-2019 | Publication: | Jun 12, 2019 |
| System Source: | Single Supplier | System Designation: | Server | Power Provisioning: | Line-powered |
| Target Load | Actual Load | ssj_ops | |
|---|---|---|---|
| Target | Actual | ||
| Calibration 1 | 5,698,142 | ||
| Calibration 2 | 5,691,695 | ||
| Calibration 3 | 5,708,712 | ||
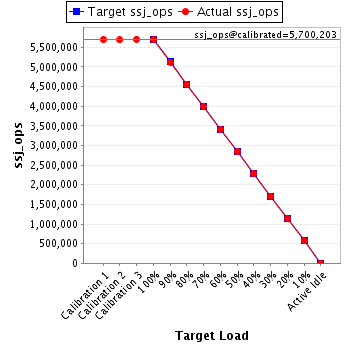
| ssj_ops@calibrated=5,700,203 | |||
| 100% | 99.8% | 5,700,203 | 5,691,572 |
| 90% | 89.9% | 5,130,183 | 5,125,947 |
| 80% | 80.0% | 4,560,163 | 4,558,531 |
| 70% | 69.9% | 3,990,142 | 3,986,308 |
| 60% | 60.0% | 3,420,122 | 3,418,058 |
| 50% | 50.1% | 2,850,102 | 2,854,673 |
| 40% | 39.9% | 2,280,081 | 2,276,167 |
| 30% | 30.0% | 1,710,061 | 1,712,248 |
| 20% | 20.0% | 1,140,041 | 1,140,395 |
| 10% | 10.0% | 570,020 | 570,410 |
| Active Idle | 0 | 0 | |
| Set Identifier: | sut |
| Set Description: | System Under Test |
| # of Identical Nodes: | 14 |
| Comment: | SUT |
| Hardware | |
|---|---|
| Hardware Vendor: | New H3C Technologies Co., Ltd. |
| Model: | H3C UniServer B5700 G3 |
| Form Factor: | Other |
| CPU Name: | Intel Xeon Platinum 8180 2.50GHz |
| CPU Characteristics: | 28-Core, 2.50 GHz, 38.5 MB L3 Cache |
| CPU Frequency (MHz): | 2500 |
| CPU(s) Enabled: | 56 cores, 2 chips, 28 cores/chip |
| Hardware Threads: | 112 (2 / core) |
| CPU(s) Orderable: | 1,2 chips |
| Primary Cache: | 32 KB I + 32 KB D on chip per core |
| Secondary Cache: | 1 MB I+D on chip per core |
| Tertiary Cache: | 39424 KB I+D on chip per chip |
| Other Cache: | None |
| Memory Amount (GB): | 192.0 |
| # and size of DIMM: | 12 x 16384 MB |
| Memory Details: | 12 x 16GB 2Rx8 PC4-2666-V ECC;slots A1, A2, A3, A4, A5, A6, B1, B2, B3, B4, B5, B6 populated |
| Power Supply Quantity and Rating (W): | None |
| Power Supply Details: | Shared |
| Disk Drive: | SATA DOM 128GB P/N DESSH-A28D09BCADCA |
| Disk Controller: | Integrated SATA controller |
| # and type of Network Interface Cards (NICs) Installed: | 1 x Intel I350 Gigabit Ethernet Controller |
| NICs Enabled in Firmware / OS / Connected: | 2/2/1 |
| Network Speed (Mbit): | 1000 |
| Keyboard: | None |
| Mouse: | None |
| Monitor: | None |
| Optical Drives: | No |
| Other Hardware: | None |
| Software | |
|---|---|
| Power Management: | Balanced Mode enabled in OS (see SUT Notes) |
| Operating System (OS): | Microsoft Windows Server 2012 R2 Datacenter |
| OS Version: | Version 6.3 (Build 9600) |
| Filesystem: | NTFS |
| JVM Vendor: | Oracle Corporation |
| JVM Version: | Java HotSpot(TM) 64-Bit Server VM (build 24.80-b11, mixed mode), version 1.7.0_80 |
| JVM Command-line Options: | -server -Xmn19g -Xms21g -Xmx21g -XX:SurvivorRatio=1 -XX:TargetSurvivorRatio=99 -XX:ParallelGCThreads=28 -XX:AllocatePrefetchDistance=256 -XX:AllocatePrefetchLines=4 -XX:LoopUnrollLimit=45 -XX:InitialTenuringThreshold=12 -XX:MaxTenuringThreshold=15 -XX:InlineSmallCode=9000 -XX:MaxInlineSize=270 -XX:FreqInlineSize=6000 -XX:+UseLargePages -XX:+UseParallelOldGC -XX:+AggressiveOpts |
| JVM Affinity: | start /NODE [0,2] /AFFINITY [0xFC0FF00FC0FF];start /NODE [1,3] /AFFINITY [0xFF03F00FF03F] |
| JVM Instances: | 4 |
| JVM Initial Heap (MB): | 21000 |
| JVM Maximum Heap (MB): | 21000 |
| JVM Address Bits: | 64 |
| Boot Firmware Version: | 2.00.25 |
| Management Firmware Version: | UIS-OM 1.00.10 |
| Workload Version: | SSJ 1.2.10 |
| Director Location: | Controller |
| Other Software: | Microsoft Windows KB3021910, clearcompressionflag.exe, KB2919355, KB2932046, KB2959977, KB2937592, KB2938439, KB2934018, KB4056898, patched to this test system in May 15, 2019 |
| JVM Instance | ssj_ops@100% |
|---|---|
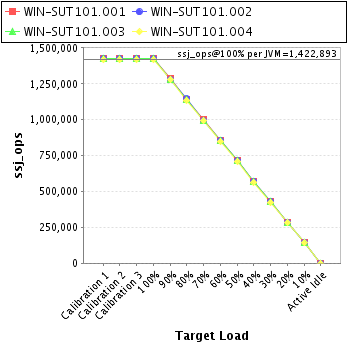
| WIN-SUT101.001 | 1,425,705 |
| WIN-SUT101.002 | 1,423,581 |
| WIN-SUT101.003 | 1,425,101 |
| WIN-SUT101.004 | 1,417,184 |
| ssj_ops@100% | 5,691,572 |
| ssj_ops@100% per JVM | 1,422,893 |
| Target Load | Actual Load | ssj_ops | |
|---|---|---|---|
| Target | Actual | ||
| Calibration 1 | 1,428,660 | ||
| Calibration 2 | 1,424,624 | ||
| Calibration 3 | 1,428,826 | ||
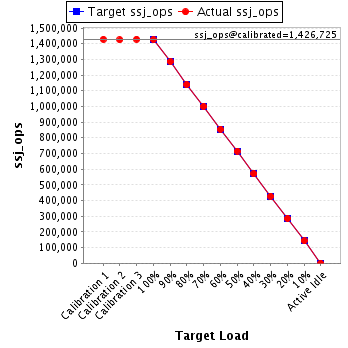
| ssj_ops@calibrated=1,426,725 | |||
| 100% | 99.9% | 1,426,725 | 1,425,705 |
| 90% | 90.1% | 1,284,052 | 1,285,604 |
| 80% | 79.8% | 1,141,380 | 1,138,911 |
| 70% | 70.2% | 998,707 | 1,001,363 |
| 60% | 59.9% | 856,035 | 855,147 |
| 50% | 50.2% | 713,362 | 715,598 |
| 40% | 40.0% | 570,690 | 570,277 |
| 30% | 30.0% | 428,017 | 428,071 |
| 20% | 20.0% | 285,345 | 285,411 |
| 10% | 10.0% | 142,672 | 143,015 |
| Active Idle | 0 | 0 | |
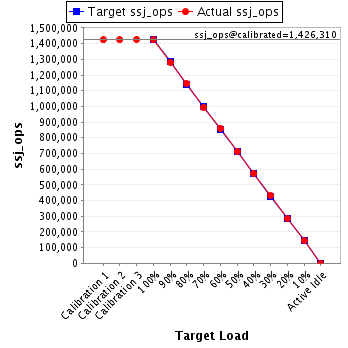
| Target Load | Actual Load | ssj_ops | |
|---|---|---|---|
| Target | Actual | ||
| Calibration 1 | 1,423,391 | ||
| Calibration 2 | 1,424,019 | ||
| Calibration 3 | 1,428,601 | ||
| ssj_ops@calibrated=1,426,310 | |||
| 100% | 99.8% | 1,426,310 | 1,423,581 |
| 90% | 89.8% | 1,283,679 | 1,281,444 |
| 80% | 80.3% | 1,141,048 | 1,145,125 |
| 70% | 69.8% | 998,417 | 995,597 |
| 60% | 60.1% | 855,786 | 857,558 |
| 50% | 50.0% | 713,155 | 713,137 |
| 40% | 40.1% | 570,524 | 571,641 |
| 30% | 30.1% | 427,893 | 429,526 |
| 20% | 20.1% | 285,262 | 286,070 |
| 10% | 10.1% | 142,631 | 143,479 |
| Active Idle | 0 | 0 | |
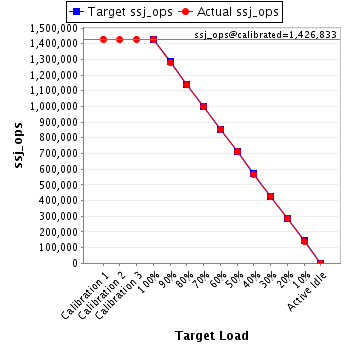
| Target Load | Actual Load | ssj_ops | |
|---|---|---|---|
| Target | Actual | ||
| Calibration 1 | 1,429,010 | ||
| Calibration 2 | 1,424,999 | ||
| Calibration 3 | 1,428,668 | ||
| ssj_ops@calibrated=1,426,833 | |||
| 100% | 99.9% | 1,426,833 | 1,425,101 |
| 90% | 89.6% | 1,284,150 | 1,278,429 |
| 80% | 79.8% | 1,141,467 | 1,138,734 |
| 70% | 69.9% | 998,783 | 997,191 |
| 60% | 59.9% | 856,100 | 854,397 |
| 50% | 50.1% | 713,417 | 715,149 |
| 40% | 39.8% | 570,733 | 568,044 |
| 30% | 30.0% | 428,050 | 428,754 |
| 20% | 20.1% | 285,367 | 286,199 |
| 10% | 9.9% | 142,683 | 141,926 |
| Active Idle | 0 | 0 | |
| Target Load | Actual Load | ssj_ops | |
|---|---|---|---|
| Target | Actual | ||
| Calibration 1 | 1,417,081 | ||
| Calibration 2 | 1,418,053 | ||
| Calibration 3 | 1,422,617 | ||
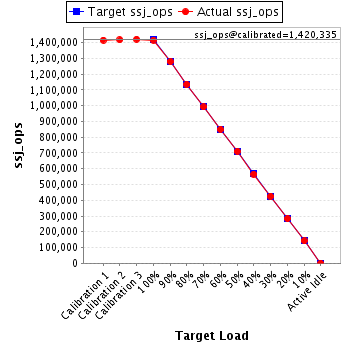
| ssj_ops@calibrated=1,420,335 | |||
| 100% | 99.8% | 1,420,335 | 1,417,184 |
| 90% | 90.2% | 1,278,302 | 1,280,470 |
| 80% | 80.0% | 1,136,268 | 1,135,761 |
| 70% | 69.9% | 994,235 | 992,157 |
| 60% | 59.9% | 852,201 | 850,956 |
| 50% | 50.0% | 710,168 | 710,788 |
| 40% | 39.9% | 568,134 | 566,205 |
| 30% | 30.0% | 426,101 | 425,898 |
| 20% | 19.9% | 284,067 | 282,715 |
| 10% | 10.0% | 142,034 | 141,990 |
| Active Idle | 0 | 0 | |