SPECpower_ssj2008
Host 'WIN-SUT109' Performance Report
Copyright © 2007-2019 Standard Performance Evaluation Corporation
| New H3C Technologies Co., Ltd. H3C UniServer B5700 G3 | ssj_ops@100% = 5,693,270 ssj_ops@100% per JVM = 1,423,318 |
||||
| Test Sponsor: | New H3C Technologies Co., Ltd. | SPEC License #: | 9066 | Test Method: | Multi Node |
| Tested By: | New H3C Technologies Co., Ltd. | Test Location: | Hangzhou, Zhejiang, China | Test Date: | May 17, 2019 |
| Hardware Availability: | Jan-2019 | Software Availability: | Jan-2019 | Publication: | Jun 12, 2019 |
| System Source: | Single Supplier | System Designation: | Server | Power Provisioning: | Line-powered |
| Target Load | Actual Load | ssj_ops | |
|---|---|---|---|
| Target | Actual | ||
| Calibration 1 | 5,698,189 | ||
| Calibration 2 | 5,693,301 | ||
| Calibration 3 | 5,701,050 | ||
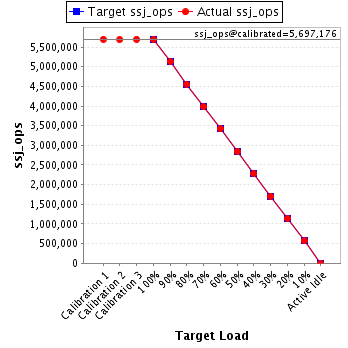
| ssj_ops@calibrated=5,697,176 | |||
| 100% | 99.9% | 5,697,176 | 5,693,270 |
| 90% | 90.1% | 5,127,458 | 5,134,090 |
| 80% | 80.0% | 4,557,741 | 4,559,689 |
| 70% | 69.9% | 3,988,023 | 3,981,952 |
| 60% | 60.0% | 3,418,305 | 3,417,948 |
| 50% | 49.9% | 2,848,588 | 2,843,478 |
| 40% | 40.0% | 2,278,870 | 2,277,410 |
| 30% | 30.0% | 1,709,153 | 1,707,866 |
| 20% | 20.0% | 1,139,435 | 1,140,401 |
| 10% | 10.0% | 569,718 | 568,673 |
| Active Idle | 0 | 0 | |
| Set Identifier: | sut |
| Set Description: | System Under Test |
| # of Identical Nodes: | 13 |
| Comment: | SUT |
| Hardware | |
|---|---|
| Hardware Vendor: | New H3C Technologies Co., Ltd. |
| Model: | H3C UniServer B5700 G3 |
| Form Factor: | Other |
| CPU Name: | Intel Xeon Platinum 8180 2.50GHz |
| CPU Characteristics: | 28-Core, 2.50 GHz, 38.5 MB L3 Cache |
| CPU Frequency (MHz): | 2500 |
| CPU(s) Enabled: | 56 cores, 2 chips, 28 cores/chip |
| Hardware Threads: | 112 (2 / core) |
| CPU(s) Orderable: | 1,2 chips |
| Primary Cache: | 32 KB I + 32 KB D on chip per core |
| Secondary Cache: | 1 MB I+D on chip per core |
| Tertiary Cache: | 39424 KB I+D on chip per chip |
| Other Cache: | None |
| Memory Amount (GB): | 192.0 |
| # and size of DIMM: | 12 x 16384 MB |
| Memory Details: | 12 x 16GB 2Rx8 PC4-2666-V ECC;slots A1, A2, A3, A4, A5, A6, B1, B2, B3, B4, B5, B6 populated |
| Power Supply Quantity and Rating (W): | None |
| Power Supply Details: | Shared |
| Disk Drive: | SATA DOM 128GB P/N DESSH-A28D09BCADCA |
| Disk Controller: | Integrated SATA controller |
| # and type of Network Interface Cards (NICs) Installed: | 1 x Intel I350 Gigabit Ethernet Controller |
| NICs Enabled in Firmware / OS / Connected: | 2/2/1 |
| Network Speed (Mbit): | 1000 |
| Keyboard: | None |
| Mouse: | None |
| Monitor: | None |
| Optical Drives: | No |
| Other Hardware: | None |
| Software | |
|---|---|
| Power Management: | Balanced Mode enabled in OS (see SUT Notes) |
| Operating System (OS): | Microsoft Windows Server 2012 R2 Datacenter |
| OS Version: | Version 6.3 (Build 9600) |
| Filesystem: | NTFS |
| JVM Vendor: | Oracle Corporation |
| JVM Version: | Java HotSpot(TM) 64-Bit Server VM (build 24.80-b11, mixed mode), version 1.7.0_80 |
| JVM Command-line Options: | -server -Xmn19g -Xms21g -Xmx21g -XX:SurvivorRatio=1 -XX:TargetSurvivorRatio=99 -XX:ParallelGCThreads=28 -XX:AllocatePrefetchDistance=256 -XX:AllocatePrefetchLines=4 -XX:LoopUnrollLimit=45 -XX:InitialTenuringThreshold=12 -XX:MaxTenuringThreshold=15 -XX:InlineSmallCode=9000 -XX:MaxInlineSize=270 -XX:FreqInlineSize=6000 -XX:+UseLargePages -XX:+UseParallelOldGC -XX:+AggressiveOpts |
| JVM Affinity: | start /NODE [0,2] /AFFINITY [0xFC0FF00FC0FF];start /NODE [1,3] /AFFINITY [0xFF03F00FF03F] |
| JVM Instances: | 4 |
| JVM Initial Heap (MB): | 21000 |
| JVM Maximum Heap (MB): | 21000 |
| JVM Address Bits: | 64 |
| Boot Firmware Version: | 2.00.25 |
| Management Firmware Version: | UIS-OM 1.00.10 |
| Workload Version: | SSJ 1.2.10 |
| Director Location: | Controller |
| Other Software: | Microsoft Windows KB3021910, clearcompressionflag.exe, KB2919355, KB2932046, KB2959977, KB2937592, KB2938439, KB2934018, KB4056898, patched to this test system in May 15, 2019 |
| JVM Instance | ssj_ops@100% |
|---|---|
| WIN-SUT109.001 | 1,415,917 |
| WIN-SUT109.002 | 1,428,233 |
| WIN-SUT109.003 | 1,426,612 |
| WIN-SUT109.004 | 1,422,508 |
| ssj_ops@100% | 5,693,270 |
| ssj_ops@100% per JVM | 1,423,318 |

| Target Load | Actual Load | ssj_ops | |
|---|---|---|---|
| Target | Actual | ||
| Calibration 1 | 1,417,599 | ||
| Calibration 2 | 1,414,932 | ||
| Calibration 3 | 1,417,948 | ||
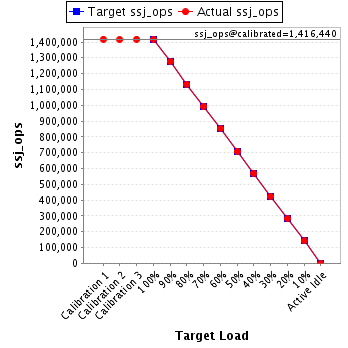
| ssj_ops@calibrated=1,416,440 | |||
| 100% | 100.0% | 1,416,440 | 1,415,917 |
| 90% | 90.1% | 1,274,796 | 1,275,901 |
| 80% | 80.0% | 1,133,152 | 1,133,644 |
| 70% | 70.0% | 991,508 | 992,175 |
| 60% | 60.2% | 849,864 | 852,941 |
| 50% | 50.0% | 708,220 | 707,579 |
| 40% | 40.1% | 566,576 | 568,073 |
| 30% | 29.9% | 424,932 | 424,152 |
| 20% | 20.0% | 283,288 | 283,723 |
| 10% | 10.0% | 141,644 | 140,974 |
| Active Idle | 0 | 0 | |
| Target Load | Actual Load | ssj_ops | |
|---|---|---|---|
| Target | Actual | ||
| Calibration 1 | 1,426,082 | ||
| Calibration 2 | 1,426,540 | ||
| Calibration 3 | 1,430,238 | ||
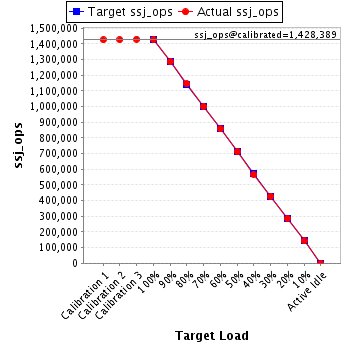
| ssj_ops@calibrated=1,428,389 | |||
| 100% | 100.0% | 1,428,389 | 1,428,233 |
| 90% | 90.0% | 1,285,550 | 1,285,508 |
| 80% | 80.1% | 1,142,711 | 1,144,582 |
| 70% | 69.9% | 999,872 | 998,534 |
| 60% | 60.0% | 857,034 | 857,019 |
| 50% | 49.9% | 714,195 | 712,834 |
| 40% | 39.8% | 571,356 | 567,848 |
| 30% | 29.9% | 428,517 | 427,375 |
| 20% | 20.0% | 285,678 | 286,347 |
| 10% | 10.0% | 142,839 | 142,151 |
| Active Idle | 0 | 0 | |
| Target Load | Actual Load | ssj_ops | |
|---|---|---|---|
| Target | Actual | ||
| Calibration 1 | 1,426,324 | ||
| Calibration 2 | 1,426,081 | ||
| Calibration 3 | 1,428,439 | ||
| ssj_ops@calibrated=1,427,260 | |||
| 100% | 100.0% | 1,427,260 | 1,426,612 |
| 90% | 90.1% | 1,284,534 | 1,286,456 |
| 80% | 80.1% | 1,141,808 | 1,142,947 |
| 70% | 69.8% | 999,082 | 996,419 |
| 60% | 59.8% | 856,356 | 853,362 |
| 50% | 49.9% | 713,630 | 712,647 |
| 40% | 40.0% | 570,904 | 570,311 |
| 30% | 30.1% | 428,178 | 430,019 |
| 20% | 19.9% | 285,452 | 284,252 |
| 10% | 10.0% | 142,726 | 142,944 |
| Active Idle | 0 | 0 | |

| Target Load | Actual Load | ssj_ops | |
|---|---|---|---|
| Target | Actual | ||
| Calibration 1 | 1,428,184 | ||
| Calibration 2 | 1,425,747 | ||
| Calibration 3 | 1,424,425 | ||
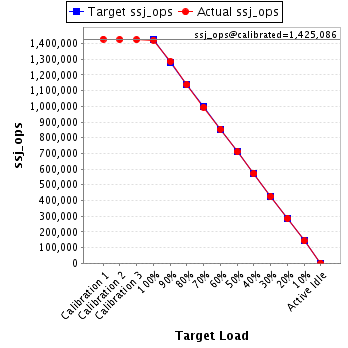
| ssj_ops@calibrated=1,425,086 | |||
| 100% | 99.8% | 1,425,086 | 1,422,508 |
| 90% | 90.3% | 1,282,577 | 1,286,225 |
| 80% | 79.9% | 1,140,069 | 1,138,515 |
| 70% | 69.8% | 997,560 | 994,823 |
| 60% | 60.0% | 855,052 | 854,626 |
| 50% | 49.9% | 712,543 | 710,419 |
| 40% | 40.1% | 570,034 | 571,177 |
| 30% | 29.9% | 427,526 | 426,320 |
| 20% | 20.1% | 285,017 | 286,078 |
| 10% | 10.0% | 142,509 | 142,604 |
| Active Idle | 0 | 0 | |