SPECpower_ssj2008
Host 'WIN-SUT105' Performance Report
Copyright © 2007-2019 Standard Performance Evaluation Corporation
| New H3C Technologies Co., Ltd. H3C UniServer B5700 G3 | ssj_ops@100% = 5,684,737 ssj_ops@100% per JVM = 1,421,184 |
||||
| Test Sponsor: | New H3C Technologies Co., Ltd. | SPEC License #: | 9066 | Test Method: | Multi Node |
| Tested By: | New H3C Technologies Co., Ltd. | Test Location: | Hangzhou, Zhejiang, China | Test Date: | May 17, 2019 |
| Hardware Availability: | Jan-2019 | Software Availability: | Jan-2019 | Publication: | Jun 12, 2019 |
| System Source: | Single Supplier | System Designation: | Server | Power Provisioning: | Line-powered |
| Target Load | Actual Load | ssj_ops | |
|---|---|---|---|
| Target | Actual | ||
| Calibration 1 | 5,695,409 | ||
| Calibration 2 | 5,684,134 | ||
| Calibration 3 | 5,700,846 | ||
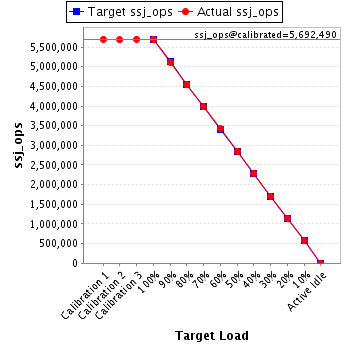
| ssj_ops@calibrated=5,692,490 | |||
| 100% | 99.9% | 5,692,490 | 5,684,737 |
| 90% | 89.9% | 5,123,241 | 5,118,766 |
| 80% | 79.9% | 4,553,992 | 4,547,566 |
| 70% | 70.0% | 3,984,743 | 3,982,747 |
| 60% | 60.0% | 3,415,494 | 3,417,683 |
| 50% | 50.0% | 2,846,245 | 2,846,523 |
| 40% | 40.1% | 2,276,996 | 2,279,893 |
| 30% | 30.0% | 1,707,747 | 1,705,402 |
| 20% | 20.0% | 1,138,498 | 1,138,704 |
| 10% | 10.0% | 569,249 | 569,089 |
| Active Idle | 0 | 0 | |
| Set Identifier: | sut |
| Set Description: | System Under Test |
| # of Identical Nodes: | 13 |
| Comment: | SUT |
| Hardware | |
|---|---|
| Hardware Vendor: | New H3C Technologies Co., Ltd. |
| Model: | H3C UniServer B5700 G3 |
| Form Factor: | Other |
| CPU Name: | Intel Xeon Platinum 8180 2.50GHz |
| CPU Characteristics: | 28-Core, 2.50 GHz, 38.5 MB L3 Cache |
| CPU Frequency (MHz): | 2500 |
| CPU(s) Enabled: | 56 cores, 2 chips, 28 cores/chip |
| Hardware Threads: | 112 (2 / core) |
| CPU(s) Orderable: | 1,2 chips |
| Primary Cache: | 32 KB I + 32 KB D on chip per core |
| Secondary Cache: | 1 MB I+D on chip per core |
| Tertiary Cache: | 39424 KB I+D on chip per chip |
| Other Cache: | None |
| Memory Amount (GB): | 192.0 |
| # and size of DIMM: | 12 x 16384 MB |
| Memory Details: | 12 x 16GB 2Rx8 PC4-2666-V ECC;slots A1, A2, A3, A4, A5, A6, B1, B2, B3, B4, B5, B6 populated |
| Power Supply Quantity and Rating (W): | None |
| Power Supply Details: | Shared |
| Disk Drive: | SATA DOM 128GB P/N DESSH-A28D09BCADCA |
| Disk Controller: | Integrated SATA controller |
| # and type of Network Interface Cards (NICs) Installed: | 1 x Intel I350 Gigabit Ethernet Controller |
| NICs Enabled in Firmware / OS / Connected: | 2/2/1 |
| Network Speed (Mbit): | 1000 |
| Keyboard: | None |
| Mouse: | None |
| Monitor: | None |
| Optical Drives: | No |
| Other Hardware: | None |
| Software | |
|---|---|
| Power Management: | Balanced Mode enabled in OS (see SUT Notes) |
| Operating System (OS): | Microsoft Windows Server 2012 R2 Datacenter |
| OS Version: | Version 6.3 (Build 9600) |
| Filesystem: | NTFS |
| JVM Vendor: | Oracle Corporation |
| JVM Version: | Java HotSpot(TM) 64-Bit Server VM (build 24.80-b11, mixed mode), version 1.7.0_80 |
| JVM Command-line Options: | -server -Xmn19g -Xms21g -Xmx21g -XX:SurvivorRatio=1 -XX:TargetSurvivorRatio=99 -XX:ParallelGCThreads=28 -XX:AllocatePrefetchDistance=256 -XX:AllocatePrefetchLines=4 -XX:LoopUnrollLimit=45 -XX:InitialTenuringThreshold=12 -XX:MaxTenuringThreshold=15 -XX:InlineSmallCode=9000 -XX:MaxInlineSize=270 -XX:FreqInlineSize=6000 -XX:+UseLargePages -XX:+UseParallelOldGC -XX:+AggressiveOpts |
| JVM Affinity: | start /NODE [0,2] /AFFINITY [0xFC0FF00FC0FF];start /NODE [1,3] /AFFINITY [0xFF03F00FF03F] |
| JVM Instances: | 4 |
| JVM Initial Heap (MB): | 21000 |
| JVM Maximum Heap (MB): | 21000 |
| JVM Address Bits: | 64 |
| Boot Firmware Version: | 2.00.25 |
| Management Firmware Version: | UIS-OM 1.00.10 |
| Workload Version: | SSJ 1.2.10 |
| Director Location: | Controller |
| Other Software: | Microsoft Windows KB3021910, clearcompressionflag.exe, KB2919355, KB2932046, KB2959977, KB2937592, KB2938439, KB2934018, KB4056898, patched to this test system in May 15, 2019 |
| JVM Instance | ssj_ops@100% |
|---|---|
| WIN-SUT105.001 | 1,413,356 |
| WIN-SUT105.002 | 1,416,998 |
| WIN-SUT105.003 | 1,432,547 |
| WIN-SUT105.004 | 1,421,836 |
| ssj_ops@100% | 5,684,737 |
| ssj_ops@100% per JVM | 1,421,184 |

| Target Load | Actual Load | ssj_ops | |
|---|---|---|---|
| Target | Actual | ||
| Calibration 1 | 1,417,722 | ||
| Calibration 2 | 1,414,732 | ||
| Calibration 3 | 1,418,515 | ||
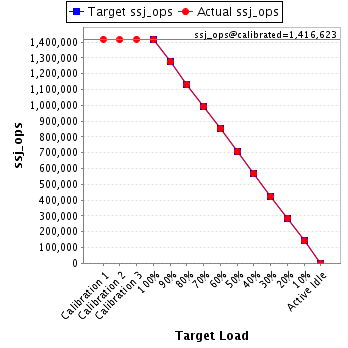
| ssj_ops@calibrated=1,416,623 | |||
| 100% | 99.8% | 1,416,623 | 1,413,356 |
| 90% | 90.0% | 1,274,961 | 1,275,387 |
| 80% | 80.0% | 1,133,299 | 1,133,561 |
| 70% | 70.0% | 991,636 | 991,805 |
| 60% | 60.2% | 849,974 | 852,823 |
| 50% | 50.0% | 708,312 | 707,893 |
| 40% | 40.1% | 566,649 | 568,148 |
| 30% | 29.9% | 424,987 | 423,940 |
| 20% | 20.1% | 283,325 | 285,075 |
| 10% | 10.0% | 141,662 | 141,284 |
| Active Idle | 0 | 0 | |
| Target Load | Actual Load | ssj_ops | |
|---|---|---|---|
| Target | Actual | ||
| Calibration 1 | 1,416,888 | ||
| Calibration 2 | 1,417,795 | ||
| Calibration 3 | 1,418,072 | ||
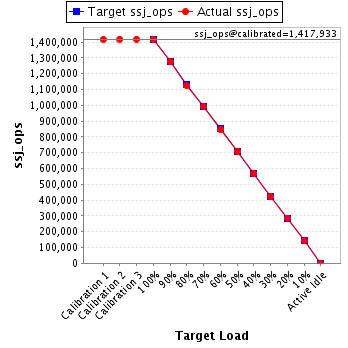
| ssj_ops@calibrated=1,417,933 | |||
| 100% | 99.9% | 1,417,933 | 1,416,998 |
| 90% | 89.9% | 1,276,140 | 1,274,755 |
| 80% | 79.2% | 1,134,347 | 1,122,787 |
| 70% | 69.9% | 992,553 | 991,838 |
| 60% | 59.8% | 850,760 | 847,587 |
| 50% | 49.8% | 708,967 | 706,484 |
| 40% | 40.1% | 567,173 | 567,889 |
| 30% | 30.0% | 425,380 | 424,778 |
| 20% | 20.2% | 283,587 | 285,870 |
| 10% | 10.1% | 141,793 | 142,674 |
| Active Idle | 0 | 0 | |
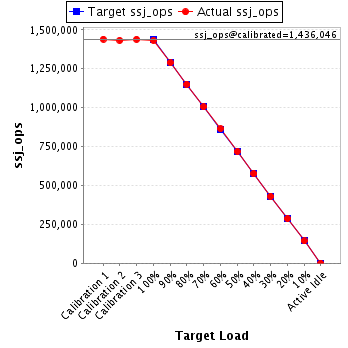
| Target Load | Actual Load | ssj_ops | |
|---|---|---|---|
| Target | Actual | ||
| Calibration 1 | 1,440,270 | ||
| Calibration 2 | 1,432,714 | ||
| Calibration 3 | 1,439,378 | ||
| ssj_ops@calibrated=1,436,046 | |||
| 100% | 99.8% | 1,436,046 | 1,432,547 |
| 90% | 89.8% | 1,292,441 | 1,289,328 |
| 80% | 80.1% | 1,148,837 | 1,150,762 |
| 70% | 70.0% | 1,005,232 | 1,005,296 |
| 60% | 60.2% | 861,628 | 864,644 |
| 50% | 50.0% | 718,023 | 718,370 |
| 40% | 40.1% | 574,418 | 575,371 |
| 30% | 30.0% | 430,814 | 430,577 |
| 20% | 19.9% | 287,209 | 286,057 |
| 10% | 10.0% | 143,605 | 143,260 |
| Active Idle | 0 | 0 | |
| Target Load | Actual Load | ssj_ops | |
|---|---|---|---|
| Target | Actual | ||
| Calibration 1 | 1,420,530 | ||
| Calibration 2 | 1,418,894 | ||
| Calibration 3 | 1,424,881 | ||
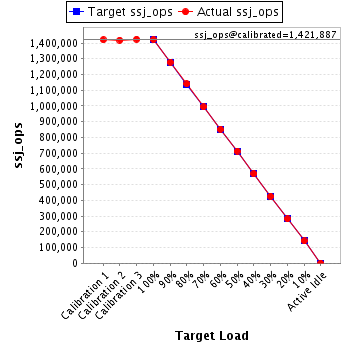
| ssj_ops@calibrated=1,421,887 | |||
| 100% | 100.0% | 1,421,887 | 1,421,836 |
| 90% | 90.0% | 1,279,698 | 1,279,296 |
| 80% | 80.2% | 1,137,510 | 1,140,456 |
| 70% | 69.9% | 995,321 | 993,808 |
| 60% | 60.0% | 853,132 | 852,630 |
| 50% | 50.2% | 710,944 | 713,776 |
| 40% | 40.0% | 568,755 | 568,485 |
| 30% | 30.0% | 426,566 | 426,106 |
| 20% | 19.8% | 284,377 | 281,702 |
| 10% | 10.0% | 142,189 | 141,871 |
| Active Idle | 0 | 0 | |