SPECpower_ssj2008
Host 'WIN-SUT111' Performance Report
Copyright © 2007-2019 Standard Performance Evaluation Corporation
| New H3C Technologies Co., Ltd. H3C UniServer B5700 G3 | ssj_ops@100% = 5,686,717 ssj_ops@100% per JVM = 1,421,679 |
||||
| Test Sponsor: | New H3C Technologies Co., Ltd. | SPEC License #: | 9066 | Test Method: | Multi Node |
| Tested By: | New H3C Technologies Co., Ltd. | Test Location: | Hangzhou, Zhejiang, China | Test Date: | May 13, 2019 |
| Hardware Availability: | Jan-2019 | Software Availability: | Jan-2019 | Publication: | Jun 12, 2019 |
| System Source: | Single Supplier | System Designation: | Server | Power Provisioning: | Line-powered |
| Target Load | Actual Load | ssj_ops | |
|---|---|---|---|
| Target | Actual | ||
| Calibration 1 | 5,706,893 | ||
| Calibration 2 | 5,698,467 | ||
| Calibration 3 | 5,703,664 | ||
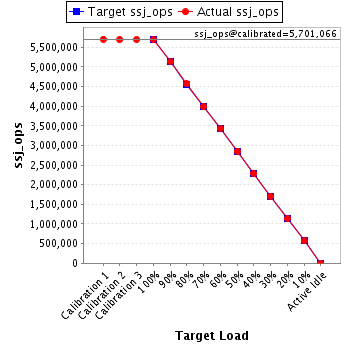
| ssj_ops@calibrated=5,701,066 | |||
| 100% | 99.7% | 5,701,066 | 5,686,717 |
| 90% | 90.0% | 5,130,959 | 5,132,449 |
| 80% | 80.1% | 4,560,853 | 4,566,675 |
| 70% | 69.9% | 3,990,746 | 3,986,050 |
| 60% | 60.1% | 3,420,639 | 3,423,964 |
| 50% | 50.0% | 2,850,533 | 2,847,860 |
| 40% | 40.0% | 2,280,426 | 2,282,803 |
| 30% | 30.0% | 1,710,320 | 1,709,432 |
| 20% | 20.0% | 1,140,213 | 1,141,892 |
| 10% | 10.0% | 570,107 | 567,392 |
| Active Idle | 0 | 0 | |
| Set Identifier: | sut |
| Set Description: | System Under Test |
| # of Identical Nodes: | 12 |
| Comment: | SUT |
| Hardware | |
|---|---|
| Hardware Vendor: | New H3C Technologies Co., Ltd. |
| Model: | H3C UniServer B5700 G3 |
| Form Factor: | Other |
| CPU Name: | Intel Xeon Platinum 8180 2.50GHz |
| CPU Characteristics: | 28-Core, 2.50 GHz, 38.5 MB L3 Cache |
| CPU Frequency (MHz): | 2500 |
| CPU(s) Enabled: | 56 cores, 2 chips, 28 cores/chip |
| Hardware Threads: | 112 (2 / core) |
| CPU(s) Orderable: | 1,2 chips |
| Primary Cache: | 32 KB I + 32 KB D on chip per core |
| Secondary Cache: | 1 MB I+D on chip per core |
| Tertiary Cache: | 39424 KB I+D on chip per chip |
| Other Cache: | None |
| Memory Amount (GB): | 192.0 |
| # and size of DIMM: | 12 x 16384 MB |
| Memory Details: | 12 x 16GB 2Rx8 PC4-2666-V ECC;slots A1, A2, A3, A4, A5, A6, B1, B2, B3, B4, B5, B6 populated |
| Power Supply Quantity and Rating (W): | None |
| Power Supply Details: | Shared |
| Disk Drive: | SATA DOM 128GB P/N DESSH-A28D09BCADCA |
| Disk Controller: | Integrated SATA controller |
| # and type of Network Interface Cards (NICs) Installed: | 1 x Intel I350 Gigabit Ethernet Controller |
| NICs Enabled in Firmware / OS / Connected: | 2/2/1 |
| Network Speed (Mbit): | 1000 |
| Keyboard: | None |
| Mouse: | None |
| Monitor: | None |
| Optical Drives: | No |
| Other Hardware: | None |
| Software | |
|---|---|
| Power Management: | Balanced Mode enabled in OS (see SUT Notes) |
| Operating System (OS): | Microsoft Windows Server 2012 R2 Datacenter |
| OS Version: | Version 6.3 (Build 9600) |
| Filesystem: | NTFS |
| JVM Vendor: | Oracle Corporation |
| JVM Version: | Java HotSpot(TM) 64-Bit Server VM (build 24.80-b11, mixed mode), version 1.7.0_80 |
| JVM Command-line Options: | -server -Xmn19g -Xms21g -Xmx21g -XX:SurvivorRatio=1 -XX:TargetSurvivorRatio=99 -XX:ParallelGCThreads=28 -XX:AllocatePrefetchDistance=256 -XX:AllocatePrefetchLines=4 -XX:LoopUnrollLimit=45 -XX:InitialTenuringThreshold=12 -XX:MaxTenuringThreshold=15 -XX:InlineSmallCode=9000 -XX:MaxInlineSize=270 -XX:FreqInlineSize=6000 -XX:+UseLargePages -XX:+UseParallelOldGC -XX:+AggressiveOpts |
| JVM Affinity: | start /NODE [0,2] /AFFINITY [0xFC0FF00FC0FF];start /NODE [1,3] /AFFINITY [0xFF03F00FF03F] |
| JVM Instances: | 4 |
| JVM Initial Heap (MB): | 21000 |
| JVM Maximum Heap (MB): | 21000 |
| JVM Address Bits: | 64 |
| Boot Firmware Version: | 2.00.25 |
| Management Firmware Version: | UIS-OM 1.00.10 |
| Workload Version: | SSJ 1.2.10 |
| Director Location: | Controller |
| Other Software: | Microsoft Windows KB3021910, clearcompressionflag.exe, KB2919355, KB2932046, KB2959977, KB2937592, KB2938439, KB2934018, KB4056898, patched to this test system in May 8, 2019 |
| JVM Instance | ssj_ops@100% |
|---|---|
| WIN-SUT111.001 | 1,416,932 |
| WIN-SUT111.002 | 1,424,645 |
| WIN-SUT111.003 | 1,421,099 |
| WIN-SUT111.004 | 1,424,042 |
| ssj_ops@100% | 5,686,717 |
| ssj_ops@100% per JVM | 1,421,679 |

| Target Load | Actual Load | ssj_ops | |
|---|---|---|---|
| Target | Actual | ||
| Calibration 1 | 1,422,811 | ||
| Calibration 2 | 1,420,711 | ||
| Calibration 3 | 1,423,273 | ||
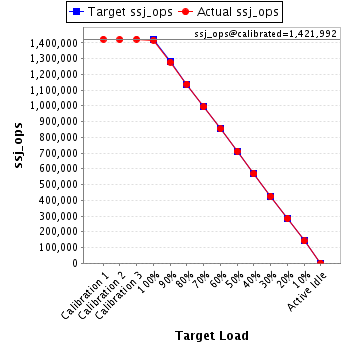
| ssj_ops@calibrated=1,421,992 | |||
| 100% | 99.6% | 1,421,992 | 1,416,932 |
| 90% | 89.8% | 1,279,793 | 1,277,246 |
| 80% | 80.0% | 1,137,593 | 1,137,381 |
| 70% | 69.8% | 995,394 | 992,983 |
| 60% | 60.0% | 853,195 | 853,177 |
| 50% | 50.0% | 710,996 | 711,238 |
| 40% | 39.9% | 568,797 | 568,047 |
| 30% | 29.9% | 426,598 | 425,872 |
| 20% | 20.0% | 284,398 | 284,549 |
| 10% | 9.9% | 142,199 | 141,462 |
| Active Idle | 0 | 0 | |
| Target Load | Actual Load | ssj_ops | |
|---|---|---|---|
| Target | Actual | ||
| Calibration 1 | 1,431,883 | ||
| Calibration 2 | 1,430,531 | ||
| Calibration 3 | 1,430,318 | ||
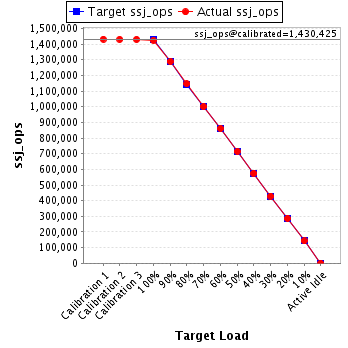
| ssj_ops@calibrated=1,430,425 | |||
| 100% | 99.6% | 1,430,425 | 1,424,645 |
| 90% | 90.1% | 1,287,382 | 1,289,361 |
| 80% | 80.2% | 1,144,340 | 1,146,880 |
| 70% | 70.0% | 1,001,297 | 1,001,699 |
| 60% | 60.2% | 858,255 | 860,911 |
| 50% | 50.0% | 715,212 | 714,749 |
| 40% | 40.1% | 572,170 | 574,309 |
| 30% | 30.0% | 429,127 | 429,692 |
| 20% | 20.0% | 286,085 | 286,510 |
| 10% | 10.0% | 143,042 | 142,458 |
| Active Idle | 0 | 0 | |
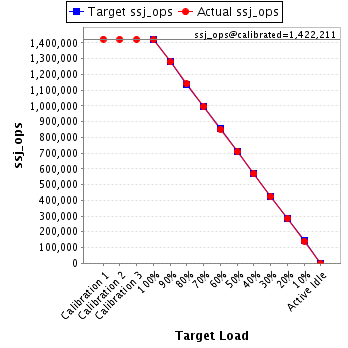
| Target Load | Actual Load | ssj_ops | |
|---|---|---|---|
| Target | Actual | ||
| Calibration 1 | 1,423,994 | ||
| Calibration 2 | 1,422,431 | ||
| Calibration 3 | 1,421,991 | ||
| ssj_ops@calibrated=1,422,211 | |||
| 100% | 99.9% | 1,422,211 | 1,421,099 |
| 90% | 89.9% | 1,279,990 | 1,279,117 |
| 80% | 80.2% | 1,137,769 | 1,139,941 |
| 70% | 70.0% | 995,548 | 996,151 |
| 60% | 59.9% | 853,326 | 852,562 |
| 50% | 49.9% | 711,105 | 710,369 |
| 40% | 39.9% | 568,884 | 568,064 |
| 30% | 29.9% | 426,663 | 424,829 |
| 20% | 20.0% | 284,442 | 284,328 |
| 10% | 9.9% | 142,221 | 140,843 |
| Active Idle | 0 | 0 | |
| Target Load | Actual Load | ssj_ops | |
|---|---|---|---|
| Target | Actual | ||
| Calibration 1 | 1,428,205 | ||
| Calibration 2 | 1,424,795 | ||
| Calibration 3 | 1,428,082 | ||
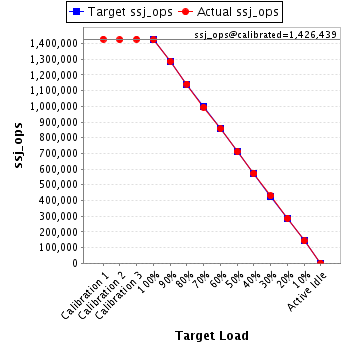
| ssj_ops@calibrated=1,426,439 | |||
| 100% | 99.8% | 1,426,439 | 1,424,042 |
| 90% | 90.2% | 1,283,795 | 1,286,725 |
| 80% | 80.1% | 1,141,151 | 1,142,472 |
| 70% | 69.8% | 998,507 | 995,217 |
| 60% | 60.1% | 855,863 | 857,314 |
| 50% | 49.9% | 713,219 | 711,504 |
| 40% | 40.1% | 570,575 | 572,383 |
| 30% | 30.1% | 427,932 | 429,040 |
| 20% | 20.1% | 285,288 | 286,505 |
| 10% | 10.0% | 142,644 | 142,630 |
| Active Idle | 0 | 0 | |