SPECpower_ssj2008
Host 'WIN-SUT102' Performance Report
Copyright © 2007-2019 Standard Performance Evaluation Corporation
| New H3C Technologies Co., Ltd. H3C UniServer B5700 G3 | ssj_ops@100% = 5,681,309 ssj_ops@100% per JVM = 1,420,327 |
||||
| Test Sponsor: | New H3C Technologies Co., Ltd. | SPEC License #: | 9066 | Test Method: | Multi Node |
| Tested By: | New H3C Technologies Co., Ltd. | Test Location: | Hangzhou, Zhejiang, China | Test Date: | May 14, 2019 |
| Hardware Availability: | Jan-2019 | Software Availability: | Jan-2019 | Publication: | Jun 12, 2019 |
| System Source: | Single Supplier | System Designation: | Server | Power Provisioning: | Line-powered |
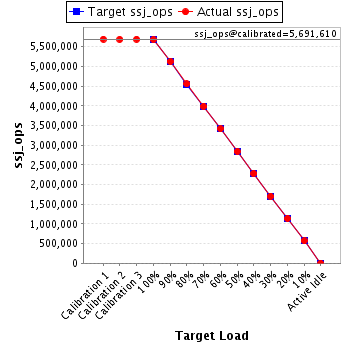
| Target Load | Actual Load | ssj_ops | |
|---|---|---|---|
| Target | Actual | ||
| Calibration 1 | 5,693,258 | ||
| Calibration 2 | 5,689,655 | ||
| Calibration 3 | 5,693,564 | ||
| ssj_ops@calibrated=5,691,610 | |||
| 100% | 99.8% | 5,691,610 | 5,681,309 |
| 90% | 90.1% | 5,122,449 | 5,126,963 |
| 80% | 80.1% | 4,553,288 | 4,557,277 |
| 70% | 70.1% | 3,984,127 | 3,991,612 |
| 60% | 60.0% | 3,414,966 | 3,415,230 |
| 50% | 50.0% | 2,845,805 | 2,843,339 |
| 40% | 40.0% | 2,276,644 | 2,276,856 |
| 30% | 30.0% | 1,707,483 | 1,705,629 |
| 20% | 20.0% | 1,138,322 | 1,138,770 |
| 10% | 10.0% | 569,161 | 570,208 |
| Active Idle | 0 | 0 | |
| Set Identifier: | sut |
| Set Description: | System Under Test |
| # of Identical Nodes: | 11 |
| Comment: | SUT |
| Hardware | |
|---|---|
| Hardware Vendor: | New H3C Technologies Co., Ltd. |
| Model: | H3C UniServer B5700 G3 |
| Form Factor: | Other |
| CPU Name: | Intel Xeon Platinum 8180 2.50GHz |
| CPU Characteristics: | 28-Core, 2.50 GHz, 38.5 MB L3 Cache |
| CPU Frequency (MHz): | 2500 |
| CPU(s) Enabled: | 56 cores, 2 chips, 28 cores/chip |
| Hardware Threads: | 112 (2 / core) |
| CPU(s) Orderable: | 1,2 chips |
| Primary Cache: | 32 KB I + 32 KB D on chip per core |
| Secondary Cache: | 1 MB I+D on chip per core |
| Tertiary Cache: | 39424 KB I+D on chip per chip |
| Other Cache: | None |
| Memory Amount (GB): | 192.0 |
| # and size of DIMM: | 12 x 16384 MB |
| Memory Details: | 12 x 16GB 2Rx8 PC4-2666-V ECC;slots A1, A2, A3, A4, A5, A6, B1, B2, B3, B4, B5, B6 populated |
| Power Supply Quantity and Rating (W): | None |
| Power Supply Details: | Shared |
| Disk Drive: | SATA DOM 128GB P/N DESSH-A28D09BCADCA |
| Disk Controller: | Integrated SATA controller |
| # and type of Network Interface Cards (NICs) Installed: | 1 x Intel I350 Gigabit Ethernet Controller |
| NICs Enabled in Firmware / OS / Connected: | 2/2/1 |
| Network Speed (Mbit): | 1000 |
| Keyboard: | None |
| Mouse: | None |
| Monitor: | None |
| Optical Drives: | No |
| Other Hardware: | None |
| Software | |
|---|---|
| Power Management: | Balanced Mode enabled in OS (see SUT Notes) |
| Operating System (OS): | Microsoft Windows Server 2012 R2 Datacenter |
| OS Version: | Version 6.3 (Build 9600) |
| Filesystem: | NTFS |
| JVM Vendor: | Oracle Corporation |
| JVM Version: | Java HotSpot(TM) 64-Bit Server VM (build 24.80-b11, mixed mode), version 1.7.0_80 |
| JVM Command-line Options: | -server -Xmn19g -Xms21g -Xmx21g -XX:SurvivorRatio=1 -XX:TargetSurvivorRatio=99 -XX:ParallelGCThreads=28 -XX:AllocatePrefetchDistance=256 -XX:AllocatePrefetchLines=4 -XX:LoopUnrollLimit=45 -XX:InitialTenuringThreshold=12 -XX:MaxTenuringThreshold=15 -XX:InlineSmallCode=9000 -XX:MaxInlineSize=270 -XX:FreqInlineSize=6000 -XX:+UseLargePages -XX:+UseParallelOldGC -XX:+AggressiveOpts |
| JVM Affinity: | start /NODE [0,2] /AFFINITY [0xFC0FF00FC0FF];start /NODE [1,3] /AFFINITY [0xFF03F00FF03F] |
| JVM Instances: | 4 |
| JVM Initial Heap (MB): | 21000 |
| JVM Maximum Heap (MB): | 21000 |
| JVM Address Bits: | 64 |
| Boot Firmware Version: | 2.00.25 |
| Management Firmware Version: | UIS-OM 1.00.10 |
| Workload Version: | SSJ 1.2.10 |
| Director Location: | Controller |
| Other Software: | Microsoft Windows KB3021910, clearcompressionflag.exe, KB2919355, KB2932046, KB2959977, KB2937592, KB2938439, KB2934018, KB4056898, patched to this test system in May 7,2019 |
| JVM Instance | ssj_ops@100% |
|---|---|
| WIN-SUT102.001 | 1,422,485 |
| WIN-SUT102.002 | 1,438,354 |
| WIN-SUT102.003 | 1,414,951 |
| WIN-SUT102.004 | 1,405,519 |
| ssj_ops@100% | 5,681,309 |
| ssj_ops@100% per JVM | 1,420,327 |

| Target Load | Actual Load | ssj_ops | |
|---|---|---|---|
| Target | Actual | ||
| Calibration 1 | 1,422,871 | ||
| Calibration 2 | 1,423,786 | ||
| Calibration 3 | 1,423,481 | ||
| ssj_ops@calibrated=1,423,633 | |||
| 100% | 99.9% | 1,423,633 | 1,422,485 |
| 90% | 89.8% | 1,281,270 | 1,278,520 |
| 80% | 79.9% | 1,138,907 | 1,138,113 |
| 70% | 69.9% | 996,543 | 995,663 |
| 60% | 60.1% | 854,180 | 855,165 |
| 50% | 49.9% | 711,817 | 710,421 |
| 40% | 40.1% | 569,453 | 570,751 |
| 30% | 29.9% | 427,090 | 425,084 |
| 20% | 19.9% | 284,727 | 283,711 |
| 10% | 10.0% | 142,363 | 142,225 |
| Active Idle | 0 | 0 | |
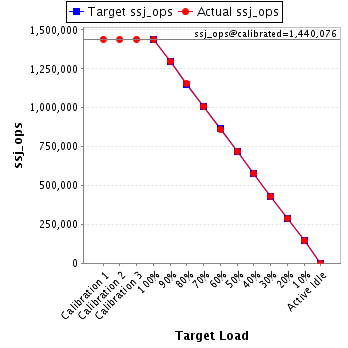
| Target Load | Actual Load | ssj_ops | |
|---|---|---|---|
| Target | Actual | ||
| Calibration 1 | 1,440,415 | ||
| Calibration 2 | 1,439,211 | ||
| Calibration 3 | 1,440,941 | ||
| ssj_ops@calibrated=1,440,076 | |||
| 100% | 99.9% | 1,440,076 | 1,438,354 |
| 90% | 90.2% | 1,296,069 | 1,299,194 |
| 80% | 80.1% | 1,152,061 | 1,154,133 |
| 70% | 70.1% | 1,008,053 | 1,008,803 |
| 60% | 59.8% | 864,046 | 861,692 |
| 50% | 50.0% | 720,038 | 720,144 |
| 40% | 40.1% | 576,031 | 577,256 |
| 30% | 30.0% | 432,023 | 431,693 |
| 20% | 20.0% | 288,015 | 288,130 |
| 10% | 10.0% | 144,008 | 144,403 |
| Active Idle | 0 | 0 | |
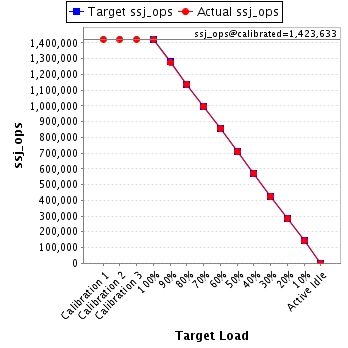
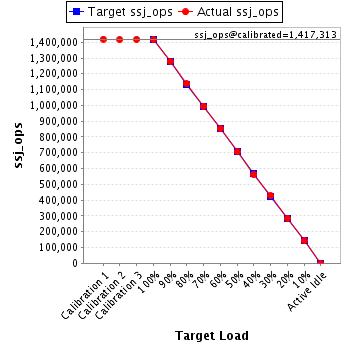
| Target Load | Actual Load | ssj_ops | |
|---|---|---|---|
| Target | Actual | ||
| Calibration 1 | 1,419,317 | ||
| Calibration 2 | 1,416,238 | ||
| Calibration 3 | 1,418,388 | ||
| ssj_ops@calibrated=1,417,313 | |||
| 100% | 99.8% | 1,417,313 | 1,414,951 |
| 90% | 90.2% | 1,275,582 | 1,278,406 |
| 80% | 80.2% | 1,133,850 | 1,136,620 |
| 70% | 70.2% | 992,119 | 995,539 |
| 60% | 60.2% | 850,388 | 852,625 |
| 50% | 49.9% | 708,656 | 707,239 |
| 40% | 39.8% | 566,925 | 563,748 |
| 30% | 30.1% | 425,194 | 426,711 |
| 20% | 20.0% | 283,463 | 284,059 |
| 10% | 10.0% | 141,731 | 142,336 |
| Active Idle | 0 | 0 | |
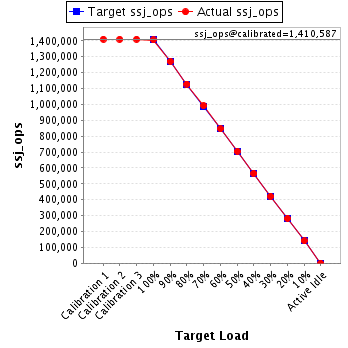
| Target Load | Actual Load | ssj_ops | |
|---|---|---|---|
| Target | Actual | ||
| Calibration 1 | 1,410,655 | ||
| Calibration 2 | 1,410,420 | ||
| Calibration 3 | 1,410,754 | ||
| ssj_ops@calibrated=1,410,587 | |||
| 100% | 99.6% | 1,410,587 | 1,405,519 |
| 90% | 90.1% | 1,269,529 | 1,270,843 |
| 80% | 80.0% | 1,128,470 | 1,128,409 |
| 70% | 70.3% | 987,411 | 991,608 |
| 60% | 60.0% | 846,352 | 845,748 |
| 50% | 50.0% | 705,294 | 705,535 |
| 40% | 40.1% | 564,235 | 565,102 |
| 30% | 29.9% | 423,176 | 422,141 |
| 20% | 20.1% | 282,117 | 282,870 |
| 10% | 10.0% | 141,059 | 141,244 |
| Active Idle | 0 | 0 | |