SPECpower_ssj2008
Host 'WIN-SUT101' Performance Report
Copyright © 2007-2019 Standard Performance Evaluation Corporation
| New H3C Technologies Co., Ltd. H3C UniServer B5700 G3 | ssj_ops@100% = 5,688,424 ssj_ops@100% per JVM = 1,422,106 |
||||
| Test Sponsor: | New H3C Technologies Co., Ltd. | SPEC License #: | 9066 | Test Method: | Multi Node |
| Tested By: | New H3C Technologies Co., Ltd. | Test Location: | Hangzhou, Zhejiang, China | Test Date: | May 14, 2019 |
| Hardware Availability: | Jan-2019 | Software Availability: | Jan-2019 | Publication: | Jun 12, 2019 |
| System Source: | Single Supplier | System Designation: | Server | Power Provisioning: | Line-powered |
| Target Load | Actual Load | ssj_ops | |
|---|---|---|---|
| Target | Actual | ||
| Calibration 1 | 5,693,070 | ||
| Calibration 2 | 5,687,679 | ||
| Calibration 3 | 5,703,487 | ||
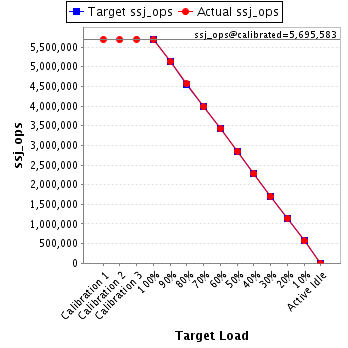
| ssj_ops@calibrated=5,695,583 | |||
| 100% | 99.9% | 5,695,583 | 5,688,424 |
| 90% | 90.2% | 5,126,025 | 5,135,140 |
| 80% | 80.1% | 4,556,466 | 4,563,562 |
| 70% | 69.9% | 3,986,908 | 3,983,959 |
| 60% | 60.1% | 3,417,350 | 3,420,857 |
| 50% | 50.0% | 2,847,792 | 2,849,579 |
| 40% | 40.0% | 2,278,233 | 2,276,629 |
| 30% | 30.0% | 1,708,675 | 1,706,740 |
| 20% | 20.0% | 1,139,117 | 1,139,191 |
| 10% | 10.0% | 569,558 | 568,441 |
| Active Idle | 0 | 0 | |
| Set Identifier: | sut |
| Set Description: | System Under Test |
| # of Identical Nodes: | 11 |
| Comment: | SUT |
| Hardware | |
|---|---|
| Hardware Vendor: | New H3C Technologies Co., Ltd. |
| Model: | H3C UniServer B5700 G3 |
| Form Factor: | Other |
| CPU Name: | Intel Xeon Platinum 8180 2.50GHz |
| CPU Characteristics: | 28-Core, 2.50 GHz, 38.5 MB L3 Cache |
| CPU Frequency (MHz): | 2500 |
| CPU(s) Enabled: | 56 cores, 2 chips, 28 cores/chip |
| Hardware Threads: | 112 (2 / core) |
| CPU(s) Orderable: | 1,2 chips |
| Primary Cache: | 32 KB I + 32 KB D on chip per core |
| Secondary Cache: | 1 MB I+D on chip per core |
| Tertiary Cache: | 39424 KB I+D on chip per chip |
| Other Cache: | None |
| Memory Amount (GB): | 192.0 |
| # and size of DIMM: | 12 x 16384 MB |
| Memory Details: | 12 x 16GB 2Rx8 PC4-2666-V ECC;slots A1, A2, A3, A4, A5, A6, B1, B2, B3, B4, B5, B6 populated |
| Power Supply Quantity and Rating (W): | None |
| Power Supply Details: | Shared |
| Disk Drive: | SATA DOM 128GB P/N DESSH-A28D09BCADCA |
| Disk Controller: | Integrated SATA controller |
| # and type of Network Interface Cards (NICs) Installed: | 1 x Intel I350 Gigabit Ethernet Controller |
| NICs Enabled in Firmware / OS / Connected: | 2/2/1 |
| Network Speed (Mbit): | 1000 |
| Keyboard: | None |
| Mouse: | None |
| Monitor: | None |
| Optical Drives: | No |
| Other Hardware: | None |
| Software | |
|---|---|
| Power Management: | Balanced Mode enabled in OS (see SUT Notes) |
| Operating System (OS): | Microsoft Windows Server 2012 R2 Datacenter |
| OS Version: | Version 6.3 (Build 9600) |
| Filesystem: | NTFS |
| JVM Vendor: | Oracle Corporation |
| JVM Version: | Java HotSpot(TM) 64-Bit Server VM (build 24.80-b11, mixed mode), version 1.7.0_80 |
| JVM Command-line Options: | -server -Xmn19g -Xms21g -Xmx21g -XX:SurvivorRatio=1 -XX:TargetSurvivorRatio=99 -XX:ParallelGCThreads=28 -XX:AllocatePrefetchDistance=256 -XX:AllocatePrefetchLines=4 -XX:LoopUnrollLimit=45 -XX:InitialTenuringThreshold=12 -XX:MaxTenuringThreshold=15 -XX:InlineSmallCode=9000 -XX:MaxInlineSize=270 -XX:FreqInlineSize=6000 -XX:+UseLargePages -XX:+UseParallelOldGC -XX:+AggressiveOpts |
| JVM Affinity: | start /NODE [0,2] /AFFINITY [0xFC0FF00FC0FF];start /NODE [1,3] /AFFINITY [0xFF03F00FF03F] |
| JVM Instances: | 4 |
| JVM Initial Heap (MB): | 21000 |
| JVM Maximum Heap (MB): | 21000 |
| JVM Address Bits: | 64 |
| Boot Firmware Version: | 2.00.25 |
| Management Firmware Version: | UIS-OM 1.00.10 |
| Workload Version: | SSJ 1.2.10 |
| Director Location: | Controller |
| Other Software: | Microsoft Windows KB3021910, clearcompressionflag.exe, KB2919355, KB2932046, KB2959977, KB2937592, KB2938439, KB2934018, KB4056898, patched to this test system in May 7,2019 |
| JVM Instance | ssj_ops@100% |
|---|---|
| WIN-SUT101.001 | 1,434,172 |
| WIN-SUT101.002 | 1,414,796 |
| WIN-SUT101.003 | 1,419,355 |
| WIN-SUT101.004 | 1,420,102 |
| ssj_ops@100% | 5,688,424 |
| ssj_ops@100% per JVM | 1,422,106 |

| Target Load | Actual Load | ssj_ops | |
|---|---|---|---|
| Target | Actual | ||
| Calibration 1 | 1,436,529 | ||
| Calibration 2 | 1,433,155 | ||
| Calibration 3 | 1,437,585 | ||
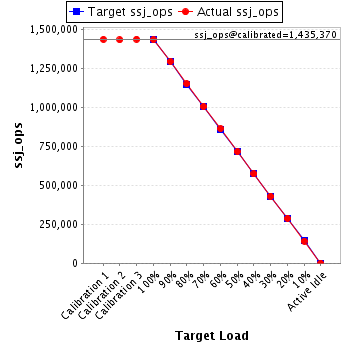
| ssj_ops@calibrated=1,435,370 | |||
| 100% | 99.9% | 1,435,370 | 1,434,172 |
| 90% | 90.2% | 1,291,833 | 1,294,207 |
| 80% | 80.3% | 1,148,296 | 1,152,164 |
| 70% | 70.1% | 1,004,759 | 1,005,885 |
| 60% | 60.2% | 861,222 | 864,049 |
| 50% | 49.9% | 717,685 | 715,764 |
| 40% | 39.9% | 574,148 | 572,851 |
| 30% | 30.0% | 430,611 | 430,471 |
| 20% | 20.0% | 287,074 | 287,559 |
| 10% | 9.9% | 143,537 | 142,195 |
| Active Idle | 0 | 0 | |
| Target Load | Actual Load | ssj_ops | |
|---|---|---|---|
| Target | Actual | ||
| Calibration 1 | 1,416,464 | ||
| Calibration 2 | 1,416,938 | ||
| Calibration 3 | 1,418,986 | ||
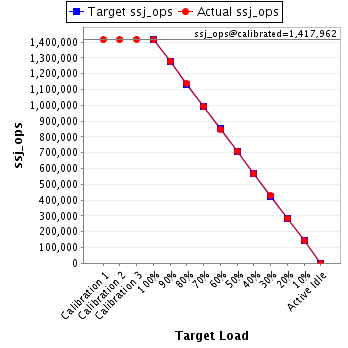
| ssj_ops@calibrated=1,417,962 | |||
| 100% | 99.8% | 1,417,962 | 1,414,796 |
| 90% | 90.3% | 1,276,166 | 1,279,716 |
| 80% | 80.3% | 1,134,370 | 1,138,187 |
| 70% | 70.1% | 992,573 | 994,578 |
| 60% | 59.9% | 850,777 | 849,596 |
| 50% | 50.1% | 708,981 | 710,821 |
| 40% | 39.9% | 567,185 | 566,397 |
| 30% | 30.0% | 425,389 | 425,975 |
| 20% | 20.0% | 283,592 | 283,314 |
| 10% | 10.0% | 141,796 | 141,763 |
| Active Idle | 0 | 0 | |
| Target Load | Actual Load | ssj_ops | |
|---|---|---|---|
| Target | Actual | ||
| Calibration 1 | 1,418,072 | ||
| Calibration 2 | 1,416,304 | ||
| Calibration 3 | 1,421,463 | ||
| ssj_ops@calibrated=1,418,884 | |||
| 100% | 100.0% | 1,418,884 | 1,419,355 |
| 90% | 90.1% | 1,276,995 | 1,277,895 |
| 80% | 79.8% | 1,135,107 | 1,132,471 |
| 70% | 69.8% | 993,218 | 990,490 |
| 60% | 60.1% | 851,330 | 852,290 |
| 50% | 50.1% | 709,442 | 711,189 |
| 40% | 40.1% | 567,553 | 568,755 |
| 30% | 29.9% | 425,665 | 423,995 |
| 20% | 19.9% | 283,777 | 282,936 |
| 10% | 10.0% | 141,888 | 142,379 |
| Active Idle | 0 | 0 | |

| Target Load | Actual Load | ssj_ops | |
|---|---|---|---|
| Target | Actual | ||
| Calibration 1 | 1,422,005 | ||
| Calibration 2 | 1,421,282 | ||
| Calibration 3 | 1,425,454 | ||
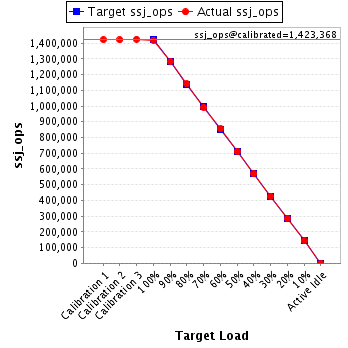
| ssj_ops@calibrated=1,423,368 | |||
| 100% | 99.8% | 1,423,368 | 1,420,102 |
| 90% | 90.2% | 1,281,031 | 1,283,322 |
| 80% | 80.1% | 1,138,694 | 1,140,741 |
| 70% | 69.8% | 996,357 | 993,006 |
| 60% | 60.1% | 854,021 | 854,922 |
| 50% | 50.0% | 711,684 | 711,806 |
| 40% | 39.9% | 569,347 | 568,627 |
| 30% | 30.0% | 427,010 | 426,299 |
| 20% | 20.0% | 284,674 | 285,382 |
| 10% | 10.0% | 142,337 | 142,104 |
| Active Idle | 0 | 0 | |