SPECpower_ssj2008
Host 'WIN-SUT108' Performance Report
Copyright © 2007-2019 Standard Performance Evaluation Corporation
| New H3C Technologies Co., Ltd. H3C UniServer B5700 G3 | ssj_ops@100% = 5,693,401 ssj_ops@100% per JVM = 1,423,350 |
||||
| Test Sponsor: | New H3C Technologies Co., Ltd. | SPEC License #: | 9066 | Test Method: | Multi Node |
| Tested By: | New H3C Technologies Co., Ltd. | Test Location: | Hangzhou, Zhejiang, China | Test Date: | Apr 27, 2019 |
| Hardware Availability: | Jan-2019 | Software Availability: | Jan-2019 | Publication: | Jun 5, 2019 |
| System Source: | Single Supplier | System Designation: | Server | Power Provisioning: | Line-powered |
| Target Load | Actual Load | ssj_ops | |
|---|---|---|---|
| Target | Actual | ||
| Calibration 1 | 5,688,850 | ||
| Calibration 2 | 5,699,027 | ||
| Calibration 3 | 5,712,756 | ||
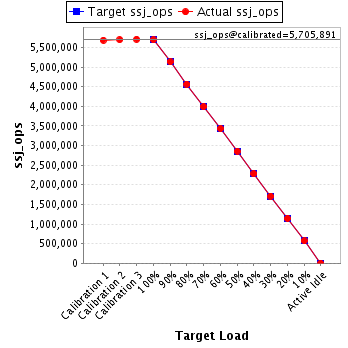
| ssj_ops@calibrated=5,705,891 | |||
| 100% | 99.8% | 5,705,891 | 5,693,401 |
| 90% | 90.0% | 5,135,302 | 5,134,694 |
| 80% | 80.1% | 4,564,713 | 4,568,003 |
| 70% | 70.0% | 3,994,124 | 3,992,124 |
| 60% | 60.2% | 3,423,535 | 3,432,413 |
| 50% | 50.1% | 2,852,946 | 2,857,613 |
| 40% | 39.9% | 2,282,356 | 2,279,225 |
| 30% | 30.1% | 1,711,767 | 1,714,636 |
| 20% | 20.0% | 1,141,178 | 1,142,947 |
| 10% | 10.0% | 570,589 | 569,115 |
| Active Idle | 0 | 0 | |
| Set Identifier: | sut |
| Set Description: | System Under Test |
| # of Identical Nodes: | 8 |
| Comment: | SUT |
| Hardware | |
|---|---|
| Hardware Vendor: | New H3C Technologies Co., Ltd. |
| Model: | H3C UniServer B5700 G3 |
| Form Factor: | Other |
| CPU Name: | Intel Xeon Platinum 8180 2.50GHz |
| CPU Characteristics: | 28-Core, 2.50 GHz, 38.5 MB L3 Cache |
| CPU Frequency (MHz): | 2500 |
| CPU(s) Enabled: | 56 cores, 2 chips, 28 cores/chip |
| Hardware Threads: | 112 (2 / core) |
| CPU(s) Orderable: | 1,2 chips |
| Primary Cache: | 32 KB I + 32 KB D on chip per core |
| Secondary Cache: | 1 MB I+D on chip per core |
| Tertiary Cache: | 39424 KB I+D on chip per chip |
| Other Cache: | None |
| Memory Amount (GB): | 192.0 |
| # and size of DIMM: | 12 x 16384 MB |
| Memory Details: | 12 x 16GB 2Rx8 PC4-2666-V ECC;slots A1, A2, A3, A4, A5, A6, B1, B2, B3, B4, B5, B6 populated |
| Power Supply Quantity and Rating (W): | None |
| Power Supply Details: | Shared |
| Disk Drive: | SATA DOM 128GB P/N DESSH-A28D09BCADCA |
| Disk Controller: | Integrated SATA controller |
| # and type of Network Interface Cards (NICs) Installed: | 1 x Intel I350 Gigabit Ethernet Controller |
| NICs Enabled in Firmware / OS / Connected: | 2/2/1 |
| Network Speed (Mbit): | 1000 |
| Keyboard: | None |
| Mouse: | None |
| Monitor: | None |
| Optical Drives: | No |
| Other Hardware: | None |
| Software | |
|---|---|
| Power Management: | Balanced Mode enabled in OS (see SUT Notes) |
| Operating System (OS): | Microsoft Windows Server 2012 R2 Datacenter |
| OS Version: | Version 6.3 (Build 9600) |
| Filesystem: | NTFS |
| JVM Vendor: | Oracle Corporation |
| JVM Version: | Java HotSpot(TM) 64-Bit Server VM (build 24.80-b11, mixed mode), version 1.7.0_80 |
| JVM Command-line Options: | -server -Xmn19g -Xms21g -Xmx21g -XX:SurvivorRatio=1 -XX:TargetSurvivorRatio=99 -XX:ParallelGCThreads=28 -XX:AllocatePrefetchDistance=256 -XX:AllocatePrefetchLines=4 -XX:LoopUnrollLimit=45 -XX:InitialTenuringThreshold=12 -XX:MaxTenuringThreshold=15 -XX:InlineSmallCode=9000 -XX:MaxInlineSize=270 -XX:FreqInlineSize=6000 -XX:+UseLargePages -XX:+UseParallelOldGC -XX:+AggressiveOpts |
| JVM Affinity: | start /NODE [0,2] /AFFINITY [0xFC0FF00FC0FF];start /NODE [1,3] /AFFINITY [0xFF03F00FF03F] |
| JVM Instances: | 4 |
| JVM Initial Heap (MB): | 21000 |
| JVM Maximum Heap (MB): | 21000 |
| JVM Address Bits: | 64 |
| Boot Firmware Version: | 2.00.25 |
| Management Firmware Version: | UIS-OM 1.00.10 |
| Workload Version: | SSJ 1.2.10 |
| Director Location: | Controller |
| Other Software: | Microsoft Windows KB3021910, clearcompressionflag.exe, KB2919355, KB2932046, KB2959977, KB2937592, KB2938439, KB2934018, KB4056898, patched to this test system in April 26, 2019 |
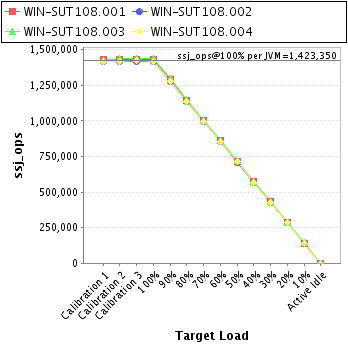
| JVM Instance | ssj_ops@100% |
|---|---|
| WIN-SUT108.001 | 1,429,521 |
| WIN-SUT108.002 | 1,414,417 |
| WIN-SUT108.003 | 1,435,124 |
| WIN-SUT108.004 | 1,414,339 |
| ssj_ops@100% | 5,693,401 |
| ssj_ops@100% per JVM | 1,423,350 |
| Target Load | Actual Load | ssj_ops | |
|---|---|---|---|
| Target | Actual | ||
| Calibration 1 | 1,430,342 | ||
| Calibration 2 | 1,428,714 | ||
| Calibration 3 | 1,433,957 | ||
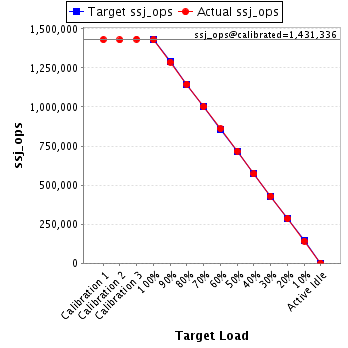
| ssj_ops@calibrated=1,431,336 | |||
| 100% | 99.9% | 1,431,336 | 1,429,521 |
| 90% | 89.9% | 1,288,202 | 1,287,213 |
| 80% | 80.0% | 1,145,069 | 1,145,336 |
| 70% | 70.1% | 1,001,935 | 1,002,660 |
| 60% | 60.1% | 858,801 | 860,859 |
| 50% | 50.1% | 715,668 | 717,393 |
| 40% | 39.9% | 572,534 | 571,320 |
| 30% | 30.1% | 429,401 | 430,241 |
| 20% | 20.0% | 286,267 | 285,824 |
| 10% | 9.9% | 143,134 | 141,754 |
| Active Idle | 0 | 0 | |
| Target Load | Actual Load | ssj_ops | |
|---|---|---|---|
| Target | Actual | ||
| Calibration 1 | 1,415,612 | ||
| Calibration 2 | 1,417,786 | ||
| Calibration 3 | 1,418,402 | ||
| ssj_ops@calibrated=1,418,094 | |||
| 100% | 99.7% | 1,418,094 | 1,414,417 |
| 90% | 89.8% | 1,276,284 | 1,273,796 |
| 80% | 80.0% | 1,134,475 | 1,134,506 |
| 70% | 69.9% | 992,666 | 991,868 |
| 60% | 60.4% | 850,856 | 856,168 |
| 50% | 49.9% | 709,047 | 707,937 |
| 40% | 40.0% | 567,238 | 567,793 |
| 30% | 30.1% | 425,428 | 426,426 |
| 20% | 20.0% | 283,619 | 283,732 |
| 10% | 10.0% | 141,809 | 141,113 |
| Active Idle | 0 | 0 | |

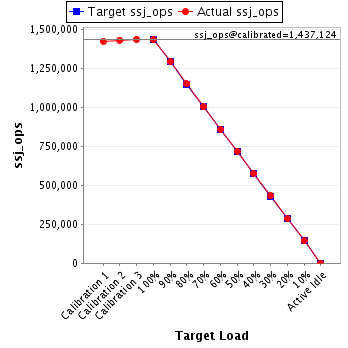
| Target Load | Actual Load | ssj_ops | |
|---|---|---|---|
| Target | Actual | ||
| Calibration 1 | 1,427,017 | ||
| Calibration 2 | 1,434,377 | ||
| Calibration 3 | 1,439,871 | ||
| ssj_ops@calibrated=1,437,124 | |||
| 100% | 99.9% | 1,437,124 | 1,435,124 |
| 90% | 90.1% | 1,293,412 | 1,294,816 |
| 80% | 80.2% | 1,149,700 | 1,151,924 |
| 70% | 69.9% | 1,005,987 | 1,004,327 |
| 60% | 60.0% | 862,275 | 861,806 |
| 50% | 50.1% | 718,562 | 720,006 |
| 40% | 40.0% | 574,850 | 574,445 |
| 30% | 30.1% | 431,137 | 432,575 |
| 20% | 20.0% | 287,425 | 287,602 |
| 10% | 10.1% | 143,712 | 144,635 |
| Active Idle | 0 | 0 | |
| Target Load | Actual Load | ssj_ops | |
|---|---|---|---|
| Target | Actual | ||
| Calibration 1 | 1,415,879 | ||
| Calibration 2 | 1,418,149 | ||
| Calibration 3 | 1,420,525 | ||
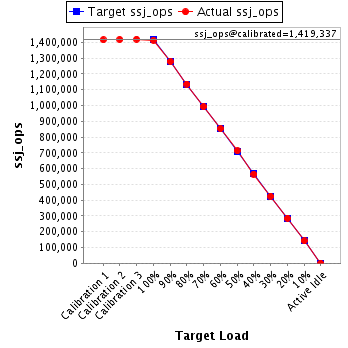
| ssj_ops@calibrated=1,419,337 | |||
| 100% | 99.6% | 1,419,337 | 1,414,339 |
| 90% | 90.1% | 1,277,403 | 1,278,869 |
| 80% | 80.1% | 1,135,470 | 1,136,236 |
| 70% | 70.0% | 993,536 | 993,268 |
| 60% | 60.1% | 851,602 | 853,580 |
| 50% | 50.2% | 709,669 | 712,276 |
| 40% | 39.9% | 567,735 | 565,668 |
| 30% | 30.0% | 425,801 | 425,394 |
| 20% | 20.1% | 283,867 | 285,789 |
| 10% | 10.0% | 141,934 | 141,613 |
| Active Idle | 0 | 0 | |