SPECpower_ssj2008
Host 'NODE12' Performance Report
Copyright © 2007-2019 Standard Performance Evaluation Corporation
| Hewlett Packard Enterprise Synergy 480 Gen10 Compute Module | ssj_ops@100% = 5,778,540 ssj_ops@100% per JVM = 1,444,635 |
||||
| Test Sponsor: | Hewlett Packard Enterprise | SPEC License #: | 3 | Test Method: | Multi Node |
| Tested By: | Hewlett Packard Enterprise | Test Location: | Houston, TX, USA | Test Date: | Apr 8, 2019 |
| Hardware Availability: | Apr-2019 | Software Availability: | Mar-2019 | Publication: | May 8, 2019 |
| System Source: | Single Supplier | System Designation: | Server | Power Provisioning: | Line-powered |
| Target Load | Actual Load | ssj_ops | |
|---|---|---|---|
| Target | Actual | ||
| Calibration 1 | 5,791,696 | ||
| Calibration 2 | 5,800,906 | ||
| Calibration 3 | 5,801,742 | ||
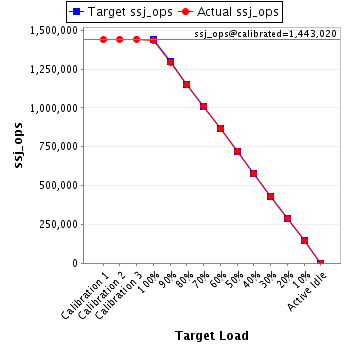
| ssj_ops@calibrated=5,801,324 | |||
| 100% | 99.6% | 5,801,324 | 5,778,540 |
| 90% | 89.9% | 5,221,192 | 5,214,751 |
| 80% | 79.8% | 4,641,059 | 4,631,411 |
| 70% | 70.0% | 4,060,927 | 4,058,131 |
| 60% | 60.1% | 3,480,794 | 3,485,790 |
| 50% | 50.0% | 2,900,662 | 2,898,895 |
| 40% | 39.9% | 2,320,530 | 2,315,867 |
| 30% | 30.0% | 1,740,397 | 1,739,830 |
| 20% | 20.0% | 1,160,265 | 1,157,742 |
| 10% | 10.0% | 580,132 | 579,472 |
| Active Idle | 0 | 0 | |
| Set Identifier: | SUT |
| Set Description: | System Under Test |
| # of Identical Nodes: | 12 |
| Comment: | SUT |
| Hardware | |
|---|---|
| Hardware Vendor: | Hewlett Packard Enterprise |
| Model: | Synergy 480 Gen10 Compute Module |
| Form Factor: | 7U |
| CPU Name: | Intel Xeon Platinum 8280 @ 2.70GHz (Intel Turbo Boost Technology up to 4.00 GHz) |
| CPU Characteristics: | 28-Core, 2.70 GHz, 38.5MB L3 Cache |
| CPU Frequency (MHz): | 2700 |
| CPU(s) Enabled: | 56 cores, 2 chips, 28 cores/chip |
| Hardware Threads: | 112 (2 / core) |
| CPU(s) Orderable: | 1,2 chips |
| Primary Cache: | 32 KB I + 32 KB D on chip per core |
| Secondary Cache: | 1 MB I+D on chip per core |
| Tertiary Cache: | 39424 KB I+D on chip per chip |
| Other Cache: | None |
| Memory Amount (GB): | 192 |
| # and size of DIMM: | 12 x 16384 MB |
| Memory Details: | 12 x 16GB 2Rx8 PC4-2933Y-R; slots 1, 3, 5, 8, 10 and 12 populated in each socket |
| Power Supply Quantity and Rating (W): | None |
| Power Supply Details: | N/A |
| Disk Drive: | 1 x HPE 240GB 6G SATA M.2 SSD (875488-B21) |
| Disk Controller: | HPE Smart Array S100i SR Gen10 |
| # and type of Network Interface Cards (NICs) Installed: | 1 x HPE Synergy 3820C 10/20Gb CNA |
| NICs Enabled in Firmware / OS / Connected: | 2/2/1 |
| Network Speed (Mbit): | 1000 |
| Keyboard: | None |
| Mouse: | None |
| Monitor: | None |
| Optical Drives: | No |
| Other Hardware: | H/S: Standard |
| Software | |
|---|---|
| Power Management: | Enabled (see SUT Notes) |
| Operating System (OS): | Windows Server 2012 R2 Datacenter |
| OS Version: | Version 6.3 (Build 9600) |
| Filesystem: | NTFS |
| JVM Vendor: | Oracle Corporation |
| JVM Version: | Oracle Java HotSpot(TM) 64-Bit Server VM (build 24.80-b11, mixed mode), version 1.7.0_80 |
| JVM Command-line Options: | -server -Xmn19000m -Xms21000m -Xmx21000m -XX:SurvivorRatio=1 -XX:TargetSurvivorRatio=99 -XX:AllocatePrefetchDistance=256 -XX:AllocatePrefetchLines=4 -XX:LoopUnrollLimit=45 -XX:InitialTenuringThreshold=12 -XX:MaxTenuringThreshold=15 -XX:ParallelGCThreads=28 -XX:InlineSmallCode=3900 -XX:MaxInlineSize=270 -XX:FreqInlineSize=2500 -XX:+AggressiveOpts -XX:+UseLargePages -XX:+UseParallelOldGC |
| JVM Affinity: | start /NODE [0,1,2,3] /AFFINITY [0xFFFFFFF] |
| JVM Instances: | 4 |
| JVM Initial Heap (MB): | 21000 |
| JVM Maximum Heap (MB): | 21000 |
| JVM Address Bits: | 64 |
| Boot Firmware Version: | I42 v2.00 (02/02/2019) |
| Management Firmware Version: | 1.40 Feb 05 2019 |
| Workload Version: | SSJ 1.2.10 |
| Director Location: | Controller |
| Other Software: | HPE Service Pack for ProLiant (SPP) Version: 2019.03.0, Microsoft Windows KB4056898, KB4338815 |
| JVM Instance | ssj_ops@100% |
|---|---|
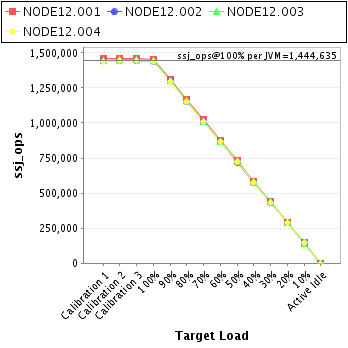
| NODE12.001 | 1,454,757 |
| NODE12.002 | 1,439,357 |
| NODE12.003 | 1,447,971 |
| NODE12.004 | 1,436,455 |
| ssj_ops@100% | 5,778,540 |
| ssj_ops@100% per JVM | 1,444,635 |
| Target Load | Actual Load | ssj_ops | |
|---|---|---|---|
| Target | Actual | ||
| Calibration 1 | 1,458,215 | ||
| Calibration 2 | 1,460,904 | ||
| Calibration 3 | 1,462,103 | ||
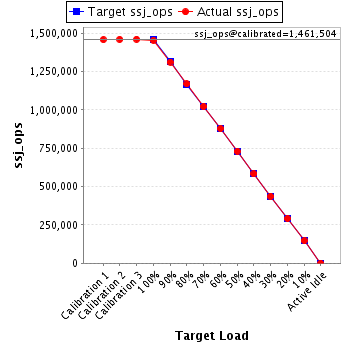
| ssj_ops@calibrated=1,461,504 | |||
| 100% | 99.5% | 1,461,504 | 1,454,757 |
| 90% | 89.8% | 1,315,353 | 1,312,895 |
| 80% | 80.1% | 1,169,203 | 1,170,554 |
| 70% | 70.0% | 1,023,052 | 1,023,420 |
| 60% | 60.1% | 876,902 | 878,322 |
| 50% | 50.0% | 730,752 | 731,141 |
| 40% | 39.9% | 584,601 | 582,754 |
| 30% | 29.9% | 438,451 | 437,252 |
| 20% | 19.9% | 292,301 | 291,563 |
| 10% | 10.0% | 146,150 | 146,718 |
| Active Idle | 0 | 0 | |
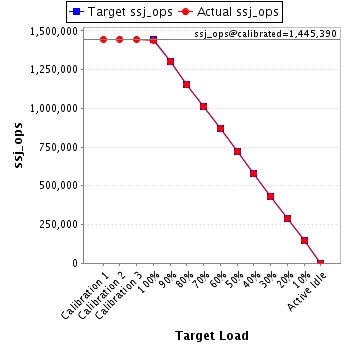
| Target Load | Actual Load | ssj_ops | |
|---|---|---|---|
| Target | Actual | ||
| Calibration 1 | 1,445,230 | ||
| Calibration 2 | 1,446,223 | ||
| Calibration 3 | 1,444,557 | ||
| ssj_ops@calibrated=1,445,390 | |||
| 100% | 99.6% | 1,445,390 | 1,439,357 |
| 90% | 89.9% | 1,300,851 | 1,299,679 |
| 80% | 79.7% | 1,156,312 | 1,151,501 |
| 70% | 70.0% | 1,011,773 | 1,012,362 |
| 60% | 60.0% | 867,234 | 867,749 |
| 50% | 49.8% | 722,695 | 720,290 |
| 40% | 39.9% | 578,156 | 577,249 |
| 30% | 29.9% | 433,617 | 432,286 |
| 20% | 19.9% | 289,078 | 287,590 |
| 10% | 10.0% | 144,539 | 144,135 |
| Active Idle | 0 | 0 | |
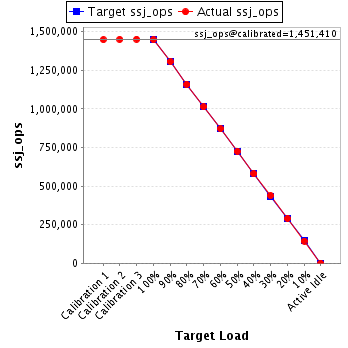
| Target Load | Actual Load | ssj_ops | |
|---|---|---|---|
| Target | Actual | ||
| Calibration 1 | 1,448,006 | ||
| Calibration 2 | 1,450,918 | ||
| Calibration 3 | 1,451,903 | ||
| ssj_ops@calibrated=1,451,410 | |||
| 100% | 99.8% | 1,451,410 | 1,447,971 |
| 90% | 90.0% | 1,306,269 | 1,306,319 |
| 80% | 79.9% | 1,161,128 | 1,159,277 |
| 70% | 69.8% | 1,015,987 | 1,013,253 |
| 60% | 60.0% | 870,846 | 871,008 |
| 50% | 50.0% | 725,705 | 725,372 |
| 40% | 39.9% | 580,564 | 579,388 |
| 30% | 30.2% | 435,423 | 438,074 |
| 20% | 20.0% | 290,282 | 290,137 |
| 10% | 9.9% | 145,141 | 144,008 |
| Active Idle | 0 | 0 | |
| Target Load | Actual Load | ssj_ops | |
|---|---|---|---|
| Target | Actual | ||
| Calibration 1 | 1,440,245 | ||
| Calibration 2 | 1,442,860 | ||
| Calibration 3 | 1,443,180 | ||
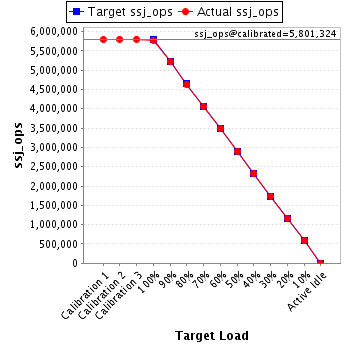
| ssj_ops@calibrated=1,443,020 | |||
| 100% | 99.5% | 1,443,020 | 1,436,455 |
| 90% | 89.8% | 1,298,718 | 1,295,859 |
| 80% | 79.7% | 1,154,416 | 1,150,080 |
| 70% | 69.9% | 1,010,114 | 1,009,097 |
| 60% | 60.2% | 865,812 | 868,712 |
| 50% | 50.0% | 721,510 | 722,092 |
| 40% | 39.9% | 577,208 | 576,476 |
| 30% | 30.0% | 432,906 | 432,217 |
| 20% | 20.0% | 288,604 | 288,452 |
| 10% | 10.0% | 144,302 | 144,611 |
| Active Idle | 0 | 0 | |