
SPECpower_ssj2008
Host 'NODE11' Performance Report
Copyright © 2007-2019 Standard Performance Evaluation Corporation
| Hewlett Packard Enterprise Synergy 480 Gen10 Compute Module | ssj_ops@100% = 5,761,544 ssj_ops@100% per JVM = 1,440,386 |
||||
| Test Sponsor: | Hewlett Packard Enterprise | SPEC License #: | 3 | Test Method: | Multi Node |
| Tested By: | Hewlett Packard Enterprise | Test Location: | Houston, TX, USA | Test Date: | Apr 8, 2019 |
| Hardware Availability: | Apr-2019 | Software Availability: | Mar-2019 | Publication: | May 8, 2019 |
| System Source: | Single Supplier | System Designation: | Server | Power Provisioning: | Line-powered |
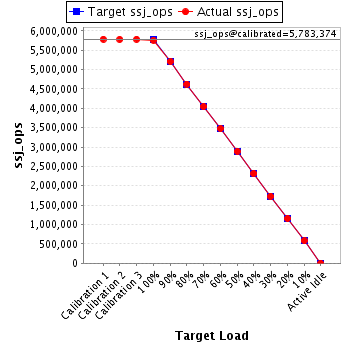
| Target Load | Actual Load | ssj_ops | |
|---|---|---|---|
| Target | Actual | ||
| Calibration 1 | 5,785,083 | ||
| Calibration 2 | 5,781,466 | ||
| Calibration 3 | 5,785,281 | ||
| ssj_ops@calibrated=5,783,374 | |||
| 100% | 99.6% | 5,783,374 | 5,761,544 |
| 90% | 90.1% | 5,205,036 | 5,209,461 |
| 80% | 80.0% | 4,626,699 | 4,626,691 |
| 70% | 70.0% | 4,048,362 | 4,048,294 |
| 60% | 60.1% | 3,470,024 | 3,475,122 |
| 50% | 50.0% | 2,891,687 | 2,892,515 |
| 40% | 40.0% | 2,313,349 | 2,313,581 |
| 30% | 29.9% | 1,735,012 | 1,731,859 |
| 20% | 20.0% | 1,156,675 | 1,156,554 |
| 10% | 10.0% | 578,337 | 580,893 |
| Active Idle | 0 | 0 | |
| Set Identifier: | SUT |
| Set Description: | System Under Test |
| # of Identical Nodes: | 12 |
| Comment: | SUT |
| Hardware | |
|---|---|
| Hardware Vendor: | Hewlett Packard Enterprise |
| Model: | Synergy 480 Gen10 Compute Module |
| Form Factor: | 7U |
| CPU Name: | Intel Xeon Platinum 8280 @ 2.70GHz (Intel Turbo Boost Technology up to 4.00 GHz) |
| CPU Characteristics: | 28-Core, 2.70 GHz, 38.5MB L3 Cache |
| CPU Frequency (MHz): | 2700 |
| CPU(s) Enabled: | 56 cores, 2 chips, 28 cores/chip |
| Hardware Threads: | 112 (2 / core) |
| CPU(s) Orderable: | 1,2 chips |
| Primary Cache: | 32 KB I + 32 KB D on chip per core |
| Secondary Cache: | 1 MB I+D on chip per core |
| Tertiary Cache: | 39424 KB I+D on chip per chip |
| Other Cache: | None |
| Memory Amount (GB): | 192 |
| # and size of DIMM: | 12 x 16384 MB |
| Memory Details: | 12 x 16GB 2Rx8 PC4-2933Y-R; slots 1, 3, 5, 8, 10 and 12 populated in each socket |
| Power Supply Quantity and Rating (W): | None |
| Power Supply Details: | N/A |
| Disk Drive: | 1 x HPE 240GB 6G SATA M.2 SSD (875488-B21) |
| Disk Controller: | HPE Smart Array S100i SR Gen10 |
| # and type of Network Interface Cards (NICs) Installed: | 1 x HPE Synergy 3820C 10/20Gb CNA |
| NICs Enabled in Firmware / OS / Connected: | 2/2/1 |
| Network Speed (Mbit): | 1000 |
| Keyboard: | None |
| Mouse: | None |
| Monitor: | None |
| Optical Drives: | No |
| Other Hardware: | H/S: Standard |
| Software | |
|---|---|
| Power Management: | Enabled (see SUT Notes) |
| Operating System (OS): | Windows Server 2012 R2 Datacenter |
| OS Version: | Version 6.3 (Build 9600) |
| Filesystem: | NTFS |
| JVM Vendor: | Oracle Corporation |
| JVM Version: | Oracle Java HotSpot(TM) 64-Bit Server VM (build 24.80-b11, mixed mode), version 1.7.0_80 |
| JVM Command-line Options: | -server -Xmn19000m -Xms21000m -Xmx21000m -XX:SurvivorRatio=1 -XX:TargetSurvivorRatio=99 -XX:AllocatePrefetchDistance=256 -XX:AllocatePrefetchLines=4 -XX:LoopUnrollLimit=45 -XX:InitialTenuringThreshold=12 -XX:MaxTenuringThreshold=15 -XX:ParallelGCThreads=28 -XX:InlineSmallCode=3900 -XX:MaxInlineSize=270 -XX:FreqInlineSize=2500 -XX:+AggressiveOpts -XX:+UseLargePages -XX:+UseParallelOldGC |
| JVM Affinity: | start /NODE [0,1,2,3] /AFFINITY [0xFFFFFFF] |
| JVM Instances: | 4 |
| JVM Initial Heap (MB): | 21000 |
| JVM Maximum Heap (MB): | 21000 |
| JVM Address Bits: | 64 |
| Boot Firmware Version: | I42 v2.00 (02/02/2019) |
| Management Firmware Version: | 1.40 Feb 05 2019 |
| Workload Version: | SSJ 1.2.10 |
| Director Location: | Controller |
| Other Software: | HPE Service Pack for ProLiant (SPP) Version: 2019.03.0, Microsoft Windows KB4056898, KB4338815 |
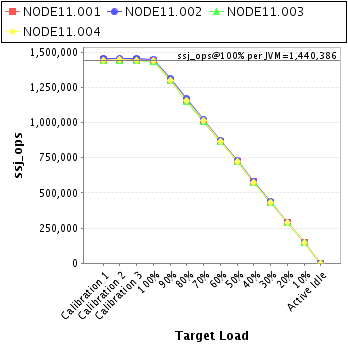
| JVM Instance | ssj_ops@100% |
|---|---|
| NODE11.001 | 1,439,693 |
| NODE11.002 | 1,449,077 |
| NODE11.003 | 1,436,270 |
| NODE11.004 | 1,436,504 |
| ssj_ops@100% | 5,761,544 |
| ssj_ops@100% per JVM | 1,440,386 |
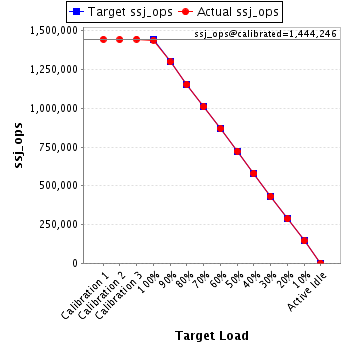
| Target Load | Actual Load | ssj_ops | |
|---|---|---|---|
| Target | Actual | ||
| Calibration 1 | 1,444,623 | ||
| Calibration 2 | 1,442,774 | ||
| Calibration 3 | 1,445,717 | ||
| ssj_ops@calibrated=1,444,246 | |||
| 100% | 99.7% | 1,444,246 | 1,439,693 |
| 90% | 90.0% | 1,299,821 | 1,299,224 |
| 80% | 79.8% | 1,155,397 | 1,152,949 |
| 70% | 69.9% | 1,010,972 | 1,009,332 |
| 60% | 60.1% | 866,547 | 868,256 |
| 50% | 50.1% | 722,123 | 722,889 |
| 40% | 40.1% | 577,698 | 579,114 |
| 30% | 30.0% | 433,274 | 432,683 |
| 20% | 19.8% | 288,849 | 286,611 |
| 10% | 10.0% | 144,425 | 144,801 |
| Active Idle | 0 | 0 | |
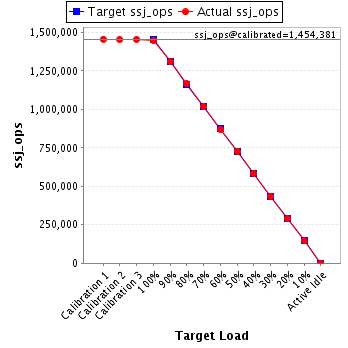
| Target Load | Actual Load | ssj_ops | |
|---|---|---|---|
| Target | Actual | ||
| Calibration 1 | 1,456,486 | ||
| Calibration 2 | 1,453,506 | ||
| Calibration 3 | 1,455,256 | ||
| ssj_ops@calibrated=1,454,381 | |||
| 100% | 99.6% | 1,454,381 | 1,449,077 |
| 90% | 90.1% | 1,308,943 | 1,310,022 |
| 80% | 80.3% | 1,163,505 | 1,167,363 |
| 70% | 70.2% | 1,018,067 | 1,020,475 |
| 60% | 60.0% | 872,629 | 872,183 |
| 50% | 50.1% | 727,191 | 728,514 |
| 40% | 40.1% | 581,752 | 582,620 |
| 30% | 30.0% | 436,314 | 436,755 |
| 20% | 20.1% | 290,876 | 292,411 |
| 10% | 10.0% | 145,438 | 145,795 |
| Active Idle | 0 | 0 | |
| Target Load | Actual Load | ssj_ops | |
|---|---|---|---|
| Target | Actual | ||
| Calibration 1 | 1,442,010 | ||
| Calibration 2 | 1,440,947 | ||
| Calibration 3 | 1,441,876 | ||
| ssj_ops@calibrated=1,441,411 | |||
| 100% | 99.6% | 1,441,411 | 1,436,270 |
| 90% | 90.1% | 1,297,270 | 1,299,416 |
| 80% | 79.9% | 1,153,129 | 1,152,166 |
| 70% | 69.8% | 1,008,988 | 1,006,820 |
| 60% | 60.1% | 864,847 | 866,612 |
| 50% | 50.0% | 720,706 | 720,741 |
| 40% | 40.0% | 576,565 | 576,416 |
| 30% | 29.9% | 432,423 | 431,432 |
| 20% | 20.0% | 288,282 | 288,253 |
| 10% | 10.1% | 144,141 | 145,429 |
| Active Idle | 0 | 0 | |

| Target Load | Actual Load | ssj_ops | |
|---|---|---|---|
| Target | Actual | ||
| Calibration 1 | 1,441,964 | ||
| Calibration 2 | 1,444,239 | ||
| Calibration 3 | 1,442,431 | ||
| ssj_ops@calibrated=1,443,335 | |||
| 100% | 99.5% | 1,443,335 | 1,436,504 |
| 90% | 90.1% | 1,299,002 | 1,300,799 |
| 80% | 80.0% | 1,154,668 | 1,154,213 |
| 70% | 70.1% | 1,010,335 | 1,011,667 |
| 60% | 60.1% | 866,001 | 868,070 |
| 50% | 49.9% | 721,668 | 720,371 |
| 40% | 39.9% | 577,334 | 575,431 |
| 30% | 29.9% | 433,001 | 430,988 |
| 20% | 20.0% | 288,667 | 289,279 |
| 10% | 10.0% | 144,334 | 144,868 |
| Active Idle | 0 | 0 | |
