SPECpower_ssj2008
Host 'NODE02' Performance Report
Copyright © 2007-2019 Standard Performance Evaluation Corporation
| Hewlett Packard Enterprise Synergy 480 Gen10 Compute Module | ssj_ops@100% = 5,734,191 ssj_ops@100% per JVM = 1,433,548 |
||||
| Test Sponsor: | Hewlett Packard Enterprise | SPEC License #: | 3 | Test Method: | Multi Node |
| Tested By: | Hewlett Packard Enterprise | Test Location: | Houston, TX, USA | Test Date: | Apr 8, 2019 |
| Hardware Availability: | Apr-2019 | Software Availability: | Mar-2019 | Publication: | May 8, 2019 |
| System Source: | Single Supplier | System Designation: | Server | Power Provisioning: | Line-powered |
| Target Load | Actual Load | ssj_ops | |
|---|---|---|---|
| Target | Actual | ||
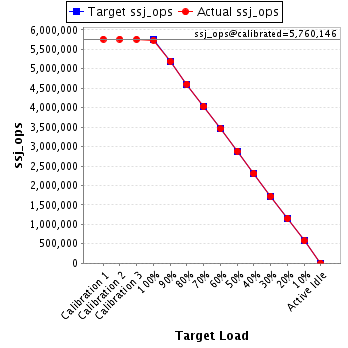
| Calibration 1 | 5,761,339 | ||
| Calibration 2 | 5,761,265 | ||
| Calibration 3 | 5,759,027 | ||
| ssj_ops@calibrated=5,760,146 | |||
| 100% | 99.5% | 5,760,146 | 5,734,191 |
| 90% | 90.1% | 5,184,131 | 5,189,375 |
| 80% | 80.0% | 4,608,117 | 4,605,522 |
| 70% | 70.1% | 4,032,102 | 4,035,822 |
| 60% | 60.0% | 3,456,087 | 3,454,174 |
| 50% | 50.0% | 2,880,073 | 2,881,528 |
| 40% | 40.0% | 2,304,058 | 2,304,289 |
| 30% | 30.0% | 1,728,044 | 1,727,102 |
| 20% | 20.0% | 1,152,029 | 1,151,627 |
| 10% | 10.0% | 576,015 | 578,791 |
| Active Idle | 0 | 0 | |
| Set Identifier: | SUT |
| Set Description: | System Under Test |
| # of Identical Nodes: | 12 |
| Comment: | SUT |
| Hardware | |
|---|---|
| Hardware Vendor: | Hewlett Packard Enterprise |
| Model: | Synergy 480 Gen10 Compute Module |
| Form Factor: | 7U |
| CPU Name: | Intel Xeon Platinum 8280 @ 2.70GHz (Intel Turbo Boost Technology up to 4.00 GHz) |
| CPU Characteristics: | 28-Core, 2.70 GHz, 38.5MB L3 Cache |
| CPU Frequency (MHz): | 2700 |
| CPU(s) Enabled: | 56 cores, 2 chips, 28 cores/chip |
| Hardware Threads: | 112 (2 / core) |
| CPU(s) Orderable: | 1,2 chips |
| Primary Cache: | 32 KB I + 32 KB D on chip per core |
| Secondary Cache: | 1 MB I+D on chip per core |
| Tertiary Cache: | 39424 KB I+D on chip per chip |
| Other Cache: | None |
| Memory Amount (GB): | 192 |
| # and size of DIMM: | 12 x 16384 MB |
| Memory Details: | 12 x 16GB 2Rx8 PC4-2933Y-R; slots 1, 3, 5, 8, 10 and 12 populated in each socket |
| Power Supply Quantity and Rating (W): | None |
| Power Supply Details: | N/A |
| Disk Drive: | 1 x HPE 240GB 6G SATA M.2 SSD (875488-B21) |
| Disk Controller: | HPE Smart Array S100i SR Gen10 |
| # and type of Network Interface Cards (NICs) Installed: | 1 x HPE Synergy 3820C 10/20Gb CNA |
| NICs Enabled in Firmware / OS / Connected: | 2/2/1 |
| Network Speed (Mbit): | 1000 |
| Keyboard: | None |
| Mouse: | None |
| Monitor: | None |
| Optical Drives: | No |
| Other Hardware: | H/S: Standard |
| Software | |
|---|---|
| Power Management: | Enabled (see SUT Notes) |
| Operating System (OS): | Windows Server 2012 R2 Datacenter |
| OS Version: | Version 6.3 (Build 9600) |
| Filesystem: | NTFS |
| JVM Vendor: | Oracle Corporation |
| JVM Version: | Oracle Java HotSpot(TM) 64-Bit Server VM (build 24.80-b11, mixed mode), version 1.7.0_80 |
| JVM Command-line Options: | -server -Xmn19000m -Xms21000m -Xmx21000m -XX:SurvivorRatio=1 -XX:TargetSurvivorRatio=99 -XX:AllocatePrefetchDistance=256 -XX:AllocatePrefetchLines=4 -XX:LoopUnrollLimit=45 -XX:InitialTenuringThreshold=12 -XX:MaxTenuringThreshold=15 -XX:ParallelGCThreads=28 -XX:InlineSmallCode=3900 -XX:MaxInlineSize=270 -XX:FreqInlineSize=2500 -XX:+AggressiveOpts -XX:+UseLargePages -XX:+UseParallelOldGC |
| JVM Affinity: | start /NODE [0,1,2,3] /AFFINITY [0xFFFFFFF] |
| JVM Instances: | 4 |
| JVM Initial Heap (MB): | 21000 |
| JVM Maximum Heap (MB): | 21000 |
| JVM Address Bits: | 64 |
| Boot Firmware Version: | I42 v2.00 (02/02/2019) |
| Management Firmware Version: | 1.40 Feb 05 2019 |
| Workload Version: | SSJ 1.2.10 |
| Director Location: | Controller |
| Other Software: | HPE Service Pack for ProLiant (SPP) Version: 2019.03.0, Microsoft Windows KB4056898, KB4338815 |
| JVM Instance | ssj_ops@100% |
|---|---|
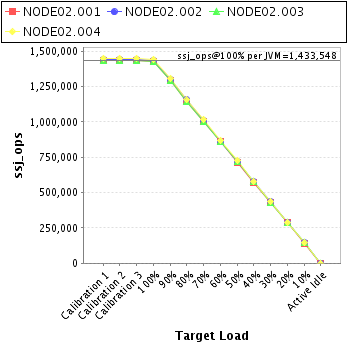
| NODE02.001 | 1,425,922 |
| NODE02.002 | 1,437,281 |
| NODE02.003 | 1,427,154 |
| NODE02.004 | 1,443,836 |
| ssj_ops@100% | 5,734,191 |
| ssj_ops@100% per JVM | 1,433,548 |
| Target Load | Actual Load | ssj_ops | |
|---|---|---|---|
| Target | Actual | ||
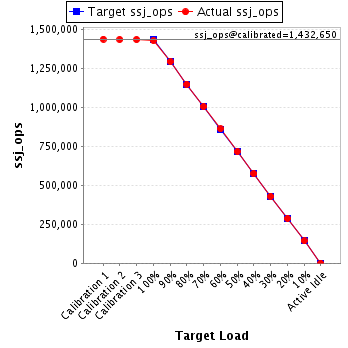
| Calibration 1 | 1,435,159 | ||
| Calibration 2 | 1,432,677 | ||
| Calibration 3 | 1,432,623 | ||
| ssj_ops@calibrated=1,432,650 | |||
| 100% | 99.5% | 1,432,650 | 1,425,922 |
| 90% | 90.1% | 1,289,385 | 1,291,304 |
| 80% | 80.0% | 1,146,120 | 1,146,708 |
| 70% | 70.1% | 1,002,855 | 1,003,917 |
| 60% | 60.1% | 859,590 | 860,767 |
| 50% | 49.9% | 716,325 | 714,934 |
| 40% | 40.0% | 573,060 | 573,543 |
| 30% | 29.9% | 429,795 | 428,991 |
| 20% | 20.0% | 286,530 | 286,394 |
| 10% | 10.0% | 143,265 | 143,338 |
| Active Idle | 0 | 0 | |
| Target Load | Actual Load | ssj_ops | |
|---|---|---|---|
| Target | Actual | ||
| Calibration 1 | 1,441,615 | ||
| Calibration 2 | 1,443,421 | ||
| Calibration 3 | 1,442,933 | ||
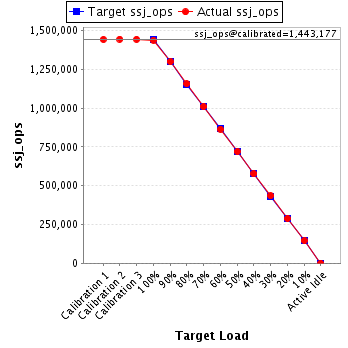
| ssj_ops@calibrated=1,443,177 | |||
| 100% | 99.6% | 1,443,177 | 1,437,281 |
| 90% | 90.0% | 1,298,859 | 1,299,076 |
| 80% | 80.1% | 1,154,541 | 1,156,564 |
| 70% | 70.0% | 1,010,224 | 1,009,512 |
| 60% | 59.9% | 865,906 | 864,258 |
| 50% | 49.9% | 721,588 | 719,439 |
| 40% | 39.9% | 577,271 | 575,994 |
| 30% | 30.1% | 432,953 | 433,713 |
| 20% | 19.9% | 288,635 | 287,679 |
| 10% | 10.1% | 144,318 | 145,705 |
| Active Idle | 0 | 0 | |
| Target Load | Actual Load | ssj_ops | |
|---|---|---|---|
| Target | Actual | ||
| Calibration 1 | 1,433,566 | ||
| Calibration 2 | 1,434,773 | ||
| Calibration 3 | 1,432,379 | ||
| ssj_ops@calibrated=1,433,576 | |||
| 100% | 99.6% | 1,433,576 | 1,427,154 |
| 90% | 90.2% | 1,290,218 | 1,292,982 |
| 80% | 80.0% | 1,146,861 | 1,146,751 |
| 70% | 70.0% | 1,003,503 | 1,004,218 |
| 60% | 60.0% | 860,146 | 860,664 |
| 50% | 50.2% | 716,788 | 720,231 |
| 40% | 40.2% | 573,430 | 576,344 |
| 30% | 29.9% | 430,073 | 428,582 |
| 20% | 20.0% | 286,715 | 286,654 |
| 10% | 10.1% | 143,358 | 144,845 |
| Active Idle | 0 | 0 | |

| Target Load | Actual Load | ssj_ops | |
|---|---|---|---|
| Target | Actual | ||
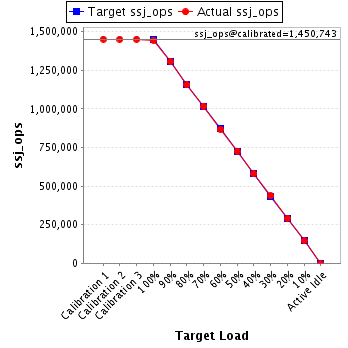
| Calibration 1 | 1,450,999 | ||
| Calibration 2 | 1,450,394 | ||
| Calibration 3 | 1,451,092 | ||
| ssj_ops@calibrated=1,450,743 | |||
| 100% | 99.5% | 1,450,743 | 1,443,836 |
| 90% | 90.0% | 1,305,669 | 1,306,014 |
| 80% | 79.6% | 1,160,594 | 1,155,499 |
| 70% | 70.2% | 1,015,520 | 1,018,173 |
| 60% | 59.9% | 870,446 | 868,484 |
| 50% | 50.1% | 725,372 | 726,924 |
| 40% | 39.9% | 580,297 | 578,408 |
| 30% | 30.0% | 435,223 | 435,816 |
| 20% | 20.1% | 290,149 | 290,900 |
| 10% | 10.0% | 145,074 | 144,903 |
| Active Idle | 0 | 0 | |