SPECpower_ssj2008
Host 'NODE01' Performance Report
Copyright © 2007-2019 Standard Performance Evaluation Corporation
| Hewlett Packard Enterprise Synergy 480 Gen10 Compute Module | ssj_ops@100% = 5,762,552 ssj_ops@100% per JVM = 1,440,638 |
||||
| Test Sponsor: | Hewlett Packard Enterprise | SPEC License #: | 3 | Test Method: | Multi Node |
| Tested By: | Hewlett Packard Enterprise | Test Location: | Houston, TX, USA | Test Date: | Apr 8, 2019 |
| Hardware Availability: | Apr-2019 | Software Availability: | Mar-2019 | Publication: | May 8, 2019 |
| System Source: | Single Supplier | System Designation: | Server | Power Provisioning: | Line-powered |
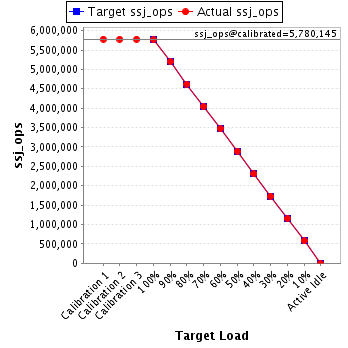
| Target Load | Actual Load | ssj_ops | |
|---|---|---|---|
| Target | Actual | ||
| Calibration 1 | 5,780,630 | ||
| Calibration 2 | 5,779,963 | ||
| Calibration 3 | 5,780,328 | ||
| ssj_ops@calibrated=5,780,145 | |||
| 100% | 99.7% | 5,780,145 | 5,762,552 |
| 90% | 90.0% | 5,202,131 | 5,201,358 |
| 80% | 80.0% | 4,624,116 | 4,623,988 |
| 70% | 69.9% | 4,046,102 | 4,042,657 |
| 60% | 60.0% | 3,468,087 | 3,466,472 |
| 50% | 50.0% | 2,890,073 | 2,890,468 |
| 40% | 39.8% | 2,312,058 | 2,302,743 |
| 30% | 30.0% | 1,734,044 | 1,734,664 |
| 20% | 20.0% | 1,156,029 | 1,156,593 |
| 10% | 10.0% | 578,015 | 577,751 |
| Active Idle | 0 | 0 | |
| Set Identifier: | SUT |
| Set Description: | System Under Test |
| # of Identical Nodes: | 12 |
| Comment: | SUT |
| Hardware | |
|---|---|
| Hardware Vendor: | Hewlett Packard Enterprise |
| Model: | Synergy 480 Gen10 Compute Module |
| Form Factor: | 7U |
| CPU Name: | Intel Xeon Platinum 8280 @ 2.70GHz (Intel Turbo Boost Technology up to 4.00 GHz) |
| CPU Characteristics: | 28-Core, 2.70 GHz, 38.5MB L3 Cache |
| CPU Frequency (MHz): | 2700 |
| CPU(s) Enabled: | 56 cores, 2 chips, 28 cores/chip |
| Hardware Threads: | 112 (2 / core) |
| CPU(s) Orderable: | 1,2 chips |
| Primary Cache: | 32 KB I + 32 KB D on chip per core |
| Secondary Cache: | 1 MB I+D on chip per core |
| Tertiary Cache: | 39424 KB I+D on chip per chip |
| Other Cache: | None |
| Memory Amount (GB): | 192 |
| # and size of DIMM: | 12 x 16384 MB |
| Memory Details: | 12 x 16GB 2Rx8 PC4-2933Y-R; slots 1, 3, 5, 8, 10 and 12 populated in each socket |
| Power Supply Quantity and Rating (W): | None |
| Power Supply Details: | N/A |
| Disk Drive: | 1 x HPE 240GB 6G SATA M.2 SSD (875488-B21) |
| Disk Controller: | HPE Smart Array S100i SR Gen10 |
| # and type of Network Interface Cards (NICs) Installed: | 1 x HPE Synergy 3820C 10/20Gb CNA |
| NICs Enabled in Firmware / OS / Connected: | 2/2/1 |
| Network Speed (Mbit): | 1000 |
| Keyboard: | None |
| Mouse: | None |
| Monitor: | None |
| Optical Drives: | No |
| Other Hardware: | H/S: Standard |
| Software | |
|---|---|
| Power Management: | Enabled (see SUT Notes) |
| Operating System (OS): | Windows Server 2012 R2 Datacenter |
| OS Version: | Version 6.3 (Build 9600) |
| Filesystem: | NTFS |
| JVM Vendor: | Oracle Corporation |
| JVM Version: | Oracle Java HotSpot(TM) 64-Bit Server VM (build 24.80-b11, mixed mode), version 1.7.0_80 |
| JVM Command-line Options: | -server -Xmn19000m -Xms21000m -Xmx21000m -XX:SurvivorRatio=1 -XX:TargetSurvivorRatio=99 -XX:AllocatePrefetchDistance=256 -XX:AllocatePrefetchLines=4 -XX:LoopUnrollLimit=45 -XX:InitialTenuringThreshold=12 -XX:MaxTenuringThreshold=15 -XX:ParallelGCThreads=28 -XX:InlineSmallCode=3900 -XX:MaxInlineSize=270 -XX:FreqInlineSize=2500 -XX:+AggressiveOpts -XX:+UseLargePages -XX:+UseParallelOldGC |
| JVM Affinity: | start /NODE [0,1,2,3] /AFFINITY [0xFFFFFFF] |
| JVM Instances: | 4 |
| JVM Initial Heap (MB): | 21000 |
| JVM Maximum Heap (MB): | 21000 |
| JVM Address Bits: | 64 |
| Boot Firmware Version: | I42 v2.00 (02/02/2019) |
| Management Firmware Version: | 1.40 Feb 05 2019 |
| Workload Version: | SSJ 1.2.10 |
| Director Location: | Controller |
| Other Software: | HPE Service Pack for ProLiant (SPP) Version: 2019.03.0, Microsoft Windows KB4056898, KB4338815 |
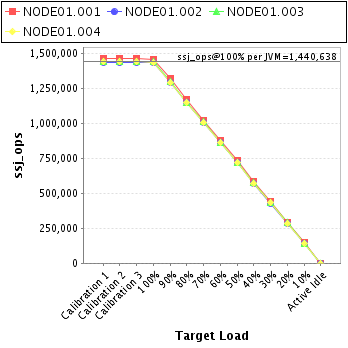
| JVM Instance | ssj_ops@100% |
|---|---|
| NODE01.001 | 1,458,887 |
| NODE01.002 | 1,431,133 |
| NODE01.003 | 1,438,991 |
| NODE01.004 | 1,433,541 |
| ssj_ops@100% | 5,762,552 |
| ssj_ops@100% per JVM | 1,440,638 |
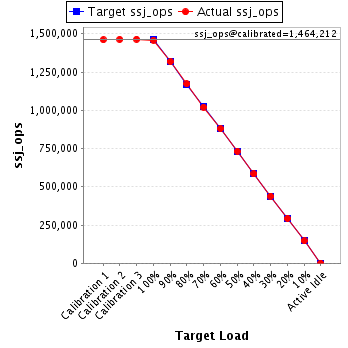
| Target Load | Actual Load | ssj_ops | |
|---|---|---|---|
| Target | Actual | ||
| Calibration 1 | 1,460,337 | ||
| Calibration 2 | 1,463,597 | ||
| Calibration 3 | 1,464,826 | ||
| ssj_ops@calibrated=1,464,212 | |||
| 100% | 99.6% | 1,464,212 | 1,458,887 |
| 90% | 90.0% | 1,317,791 | 1,318,292 |
| 80% | 80.1% | 1,171,369 | 1,172,496 |
| 70% | 69.8% | 1,024,948 | 1,021,428 |
| 60% | 60.1% | 878,527 | 879,413 |
| 50% | 50.0% | 732,106 | 732,094 |
| 40% | 39.9% | 585,685 | 583,605 |
| 30% | 30.0% | 439,264 | 439,622 |
| 20% | 20.0% | 292,842 | 292,859 |
| 10% | 10.0% | 146,421 | 146,147 |
| Active Idle | 0 | 0 | |
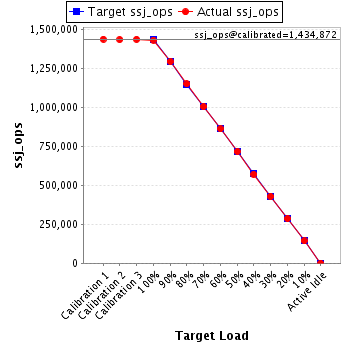
| Target Load | Actual Load | ssj_ops | |
|---|---|---|---|
| Target | Actual | ||
| Calibration 1 | 1,436,620 | ||
| Calibration 2 | 1,433,966 | ||
| Calibration 3 | 1,435,778 | ||
| ssj_ops@calibrated=1,434,872 | |||
| 100% | 99.7% | 1,434,872 | 1,431,133 |
| 90% | 90.1% | 1,291,385 | 1,293,517 |
| 80% | 80.2% | 1,147,898 | 1,150,404 |
| 70% | 70.0% | 1,004,410 | 1,004,130 |
| 60% | 60.0% | 860,923 | 860,984 |
| 50% | 49.9% | 717,436 | 716,172 |
| 40% | 39.8% | 573,949 | 570,541 |
| 30% | 29.9% | 430,462 | 428,746 |
| 20% | 19.9% | 286,974 | 285,563 |
| 10% | 10.0% | 143,487 | 143,567 |
| Active Idle | 0 | 0 | |
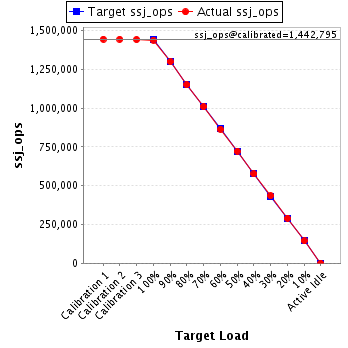
| Target Load | Actual Load | ssj_ops | |
|---|---|---|---|
| Target | Actual | ||
| Calibration 1 | 1,444,463 | ||
| Calibration 2 | 1,444,031 | ||
| Calibration 3 | 1,441,559 | ||
| ssj_ops@calibrated=1,442,795 | |||
| 100% | 99.7% | 1,442,795 | 1,438,991 |
| 90% | 90.1% | 1,298,516 | 1,299,324 |
| 80% | 79.8% | 1,154,236 | 1,150,696 |
| 70% | 70.0% | 1,009,957 | 1,009,901 |
| 60% | 59.9% | 865,677 | 864,631 |
| 50% | 50.1% | 721,398 | 722,886 |
| 40% | 39.9% | 577,118 | 575,407 |
| 30% | 30.1% | 432,839 | 434,185 |
| 20% | 20.1% | 288,559 | 290,650 |
| 10% | 10.0% | 144,280 | 144,446 |
| Active Idle | 0 | 0 | |
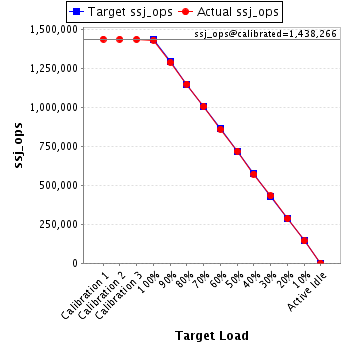
| Target Load | Actual Load | ssj_ops | |
|---|---|---|---|
| Target | Actual | ||
| Calibration 1 | 1,439,211 | ||
| Calibration 2 | 1,438,369 | ||
| Calibration 3 | 1,438,164 | ||
| ssj_ops@calibrated=1,438,266 | |||
| 100% | 99.7% | 1,438,266 | 1,433,541 |
| 90% | 89.7% | 1,294,440 | 1,290,226 |
| 80% | 80.0% | 1,150,613 | 1,150,392 |
| 70% | 70.0% | 1,006,786 | 1,007,198 |
| 60% | 59.9% | 862,960 | 861,444 |
| 50% | 50.0% | 719,133 | 719,316 |
| 40% | 39.9% | 575,307 | 573,190 |
| 30% | 30.0% | 431,480 | 432,111 |
| 20% | 20.0% | 287,653 | 287,522 |
| 10% | 10.0% | 143,827 | 143,592 |
| Active Idle | 0 | 0 | |