
SPECpower_ssj2008
Host 'NODE02' Performance Report
Copyright © 2007-2019 Standard Performance Evaluation Corporation
| Hewlett Packard Enterprise Synergy 480 Gen10 Compute Module | ssj_ops@100% = 5,770,768 ssj_ops@100% per JVM = 1,442,692 |
||||
| Test Sponsor: | Hewlett Packard Enterprise | SPEC License #: | 3 | Test Method: | Multi Node |
| Tested By: | Hewlett Packard Enterprise | Test Location: | Houston, TX, USA | Test Date: | Mar 26, 2019 |
| Hardware Availability: | Apr-2019 | Software Availability: | Mar-2019 | Publication: | May 8, 2019 |
| System Source: | Single Supplier | System Designation: | Server | Power Provisioning: | Line-powered |
| Target Load | Actual Load | ssj_ops | |
|---|---|---|---|
| Target | Actual | ||
| Calibration 1 | 5,791,186 | ||
| Calibration 2 | 5,784,212 | ||
| Calibration 3 | 5,787,550 | ||
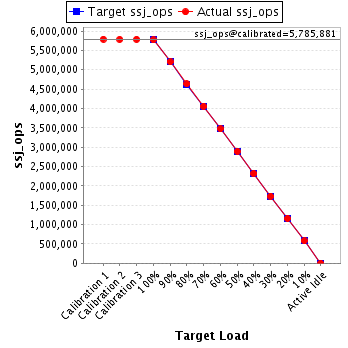
| ssj_ops@calibrated=5,785,881 | |||
| 100% | 99.7% | 5,785,881 | 5,770,768 |
| 90% | 90.0% | 5,207,293 | 5,205,789 |
| 80% | 80.1% | 4,628,705 | 4,637,333 |
| 70% | 70.2% | 4,050,117 | 4,061,726 |
| 60% | 60.0% | 3,471,529 | 3,470,360 |
| 50% | 50.0% | 2,892,941 | 2,892,723 |
| 40% | 40.0% | 2,314,352 | 2,315,605 |
| 30% | 30.0% | 1,735,764 | 1,735,590 |
| 20% | 20.0% | 1,157,176 | 1,156,698 |
| 10% | 10.0% | 578,588 | 578,965 |
| Active Idle | 0 | 0 | |
| Set Identifier: | SUT |
| Set Description: | System Under Test |
| # of Identical Nodes: | 6 |
| Comment: | SUT |
| Hardware | |
|---|---|
| Hardware Vendor: | Hewlett Packard Enterprise |
| Model: | Synergy 480 Gen10 Compute Module |
| Form Factor: | 7U |
| CPU Name: | Intel Xeon Platinum 8280 @ 2.70GHz (Intel Turbo Boost Technology up to 4.00 GHz) |
| CPU Characteristics: | 28-Core, 2.70 GHz, 38.5MB L3 Cache |
| CPU Frequency (MHz): | 2700 |
| CPU(s) Enabled: | 56 cores, 2 chips, 28 cores/chip |
| Hardware Threads: | 112 (2 / core) |
| CPU(s) Orderable: | 1,2 chips |
| Primary Cache: | 32 KB I + 32 KB D on chip per core |
| Secondary Cache: | 1 MB I+D on chip per core |
| Tertiary Cache: | 39424 KB I+D on chip per chip |
| Other Cache: | None |
| Memory Amount (GB): | 192 |
| # and size of DIMM: | 12 x 16384 MB |
| Memory Details: | 12 x 16GB 2Rx8 PC4-2933Y-R; slots 1, 3, 5, 8, 10 and 12 populated in each socket |
| Power Supply Quantity and Rating (W): | None |
| Power Supply Details: | N/A |
| Disk Drive: | 1 x HPE 240GB 6G SATA M.2 SSD (875488-B21) |
| Disk Controller: | HPE Smart Array S100i SR Gen10 |
| # and type of Network Interface Cards (NICs) Installed: | 1 x HPE Synergy 3820C 10/20Gb CNA |
| NICs Enabled in Firmware / OS / Connected: | 2/2/1 |
| Network Speed (Mbit): | 1000 |
| Keyboard: | None |
| Mouse: | None |
| Monitor: | None |
| Optical Drives: | No |
| Other Hardware: | H/S: Standard |
| Software | |
|---|---|
| Power Management: | Enabled (see SUT Notes) |
| Operating System (OS): | Windows Server 2012 R2 Datacenter |
| OS Version: | Version 6.3 (Build 9600) |
| Filesystem: | NTFS |
| JVM Vendor: | Oracle Corporation |
| JVM Version: | Oracle Java HotSpot(TM) 64-Bit Server VM (build 24.80-b11, mixed mode), version 1.7.0_80 |
| JVM Command-line Options: | -server -Xmn21000m -Xms24000m -Xmx24000m -XX:SurvivorRatio=1 -XX:TargetSurvivorRatio=99 -XX:AllocatePrefetchDistance=256 -XX:AllocatePrefetchLines=4 -XX:LoopUnrollLimit=45 -XX:InitialTenuringThreshold=12 -XX:MaxTenuringThreshold=15 -XX:ParallelGCThreads=28 -XX:InlineSmallCode=3900 -XX:MaxInlineSize=270 -XX:FreqInlineSize=2500 -XX:+AggressiveOpts -XX:+UseLargePages -XX:+UseParallelOldGC |
| JVM Affinity: | start /NODE [0,1,2,3] /AFFINITY [0xFFFFFFF] |
| JVM Instances: | 4 |
| JVM Initial Heap (MB): | 24000 |
| JVM Maximum Heap (MB): | 24000 |
| JVM Address Bits: | 64 |
| Boot Firmware Version: | I42 v2.00 (02/02/2019) |
| Management Firmware Version: | 1.40 Feb 05 2019 |
| Workload Version: | SSJ 1.2.10 |
| Director Location: | Controller |
| Other Software: | HPE Service Pack for ProLiant (SPP) Version: 2019.03.0, Microsoft Windows KB4056898, KB4338815 |
| JVM Instance | ssj_ops@100% |
|---|---|
| NODE02.001 | 1,438,060 |
| NODE02.002 | 1,429,646 |
| NODE02.003 | 1,443,046 |
| NODE02.004 | 1,460,016 |
| ssj_ops@100% | 5,770,768 |
| ssj_ops@100% per JVM | 1,442,692 |

| Target Load | Actual Load | ssj_ops | |
|---|---|---|---|
| Target | Actual | ||
| Calibration 1 | 1,445,345 | ||
| Calibration 2 | 1,441,364 | ||
| Calibration 3 | 1,441,787 | ||
| ssj_ops@calibrated=1,441,576 | |||
| 100% | 99.8% | 1,441,576 | 1,438,060 |
| 90% | 89.9% | 1,297,418 | 1,296,359 |
| 80% | 80.0% | 1,153,260 | 1,152,798 |
| 70% | 70.3% | 1,009,103 | 1,014,040 |
| 60% | 59.8% | 864,945 | 862,659 |
| 50% | 50.2% | 720,788 | 723,002 |
| 40% | 40.1% | 576,630 | 577,506 |
| 30% | 29.9% | 432,473 | 431,617 |
| 20% | 20.1% | 288,315 | 289,126 |
| 10% | 10.1% | 144,158 | 145,338 |
| Active Idle | 0 | 0 | |

| Target Load | Actual Load | ssj_ops | |
|---|---|---|---|
| Target | Actual | ||
| Calibration 1 | 1,433,626 | ||
| Calibration 2 | 1,431,188 | ||
| Calibration 3 | 1,433,406 | ||
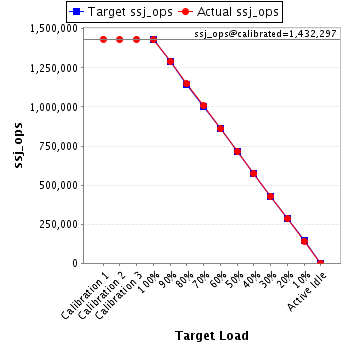
| ssj_ops@calibrated=1,432,297 | |||
| 100% | 99.8% | 1,432,297 | 1,429,646 |
| 90% | 90.2% | 1,289,068 | 1,292,378 |
| 80% | 80.2% | 1,145,838 | 1,149,369 |
| 70% | 70.3% | 1,002,608 | 1,006,560 |
| 60% | 60.0% | 859,378 | 859,127 |
| 50% | 49.9% | 716,149 | 714,484 |
| 40% | 39.9% | 572,919 | 571,970 |
| 30% | 29.9% | 429,689 | 428,296 |
| 20% | 19.9% | 286,459 | 285,735 |
| 10% | 9.9% | 143,230 | 141,963 |
| Active Idle | 0 | 0 | |
| Target Load | Actual Load | ssj_ops | |
|---|---|---|---|
| Target | Actual | ||
| Calibration 1 | 1,448,327 | ||
| Calibration 2 | 1,449,351 | ||
| Calibration 3 | 1,448,064 | ||
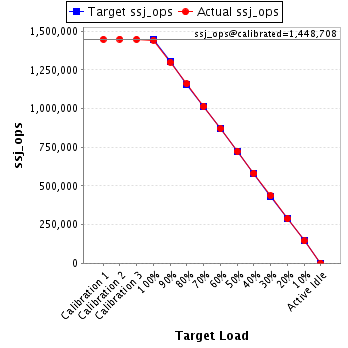
| ssj_ops@calibrated=1,448,708 | |||
| 100% | 99.6% | 1,448,708 | 1,443,046 |
| 90% | 89.8% | 1,303,837 | 1,300,289 |
| 80% | 80.2% | 1,158,966 | 1,161,362 |
| 70% | 70.1% | 1,014,095 | 1,015,430 |
| 60% | 60.1% | 869,225 | 871,174 |
| 50% | 49.9% | 724,354 | 723,524 |
| 40% | 40.1% | 579,483 | 581,198 |
| 30% | 30.1% | 434,612 | 435,908 |
| 20% | 19.9% | 289,742 | 287,683 |
| 10% | 10.0% | 144,871 | 144,884 |
| Active Idle | 0 | 0 | |
| Target Load | Actual Load | ssj_ops | |
|---|---|---|---|
| Target | Actual | ||
| Calibration 1 | 1,463,889 | ||
| Calibration 2 | 1,462,309 | ||
| Calibration 3 | 1,464,291 | ||
| ssj_ops@calibrated=1,463,300 | |||
| 100% | 99.8% | 1,463,300 | 1,460,016 |
| 90% | 90.0% | 1,316,970 | 1,316,762 |
| 80% | 80.2% | 1,170,640 | 1,173,804 |
| 70% | 70.1% | 1,024,310 | 1,025,697 |
| 60% | 60.0% | 877,980 | 877,400 |
| 50% | 50.0% | 731,650 | 731,713 |
| 40% | 40.0% | 585,320 | 584,931 |
| 30% | 30.1% | 438,990 | 439,769 |
| 20% | 20.1% | 292,660 | 294,154 |
| 10% | 10.0% | 146,330 | 146,780 |
| Active Idle | 0 | 0 | |
