SPECpower_ssj2008
Host 'NODE06' Performance Report
Copyright © 2007-2019 Standard Performance Evaluation Corporation
| Hewlett Packard Enterprise Synergy 480 Gen10 Compute Module | ssj_ops@100% = 5,758,661 ssj_ops@100% per JVM = 1,439,665 |
||||
| Test Sponsor: | Hewlett Packard Enterprise | SPEC License #: | 3 | Test Method: | Multi Node |
| Tested By: | Hewlett Packard Enterprise | Test Location: | Houston, TX, USA | Test Date: | Mar 26, 2019 |
| Hardware Availability: | Apr-2019 | Software Availability: | Mar-2019 | Publication: | May 8, 2019 |
| System Source: | Single Supplier | System Designation: | Server | Power Provisioning: | Line-powered |
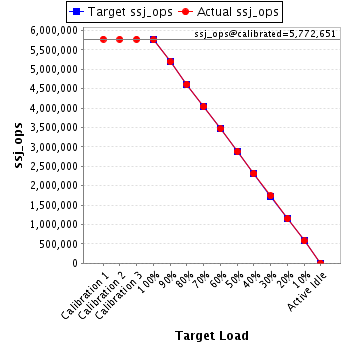
| Target Load | Actual Load | ssj_ops | |
|---|---|---|---|
| Target | Actual | ||
| Calibration 1 | 5,776,666 | ||
| Calibration 2 | 5,770,790 | ||
| Calibration 3 | 5,774,512 | ||
| ssj_ops@calibrated=5,772,651 | |||
| 100% | 99.8% | 5,772,651 | 5,758,661 |
| 90% | 90.0% | 5,195,386 | 5,195,478 |
| 80% | 79.9% | 4,618,121 | 4,612,670 |
| 70% | 70.0% | 4,040,856 | 4,039,897 |
| 60% | 60.0% | 3,463,591 | 3,463,286 |
| 50% | 49.9% | 2,886,325 | 2,879,418 |
| 40% | 40.0% | 2,309,060 | 2,309,239 |
| 30% | 30.0% | 1,731,795 | 1,733,935 |
| 20% | 19.9% | 1,154,530 | 1,148,912 |
| 10% | 10.0% | 577,265 | 576,636 |
| Active Idle | 0 | 0 | |
| Set Identifier: | SUT |
| Set Description: | System Under Test |
| # of Identical Nodes: | 7 |
| Comment: | SUT |
| Hardware | |
|---|---|
| Hardware Vendor: | Hewlett Packard Enterprise |
| Model: | Synergy 480 Gen10 Compute Module |
| Form Factor: | 7U |
| CPU Name: | Intel Xeon Platinum 8280 @ 2.70GHz (Intel Turbo Boost Technology up to 4.00 GHz) |
| CPU Characteristics: | 28-Core, 2.70 GHz, 38.5MB L3 Cache |
| CPU Frequency (MHz): | 2700 |
| CPU(s) Enabled: | 56 cores, 2 chips, 28 cores/chip |
| Hardware Threads: | 112 (2 / core) |
| CPU(s) Orderable: | 1,2 chips |
| Primary Cache: | 32 KB I + 32 KB D on chip per core |
| Secondary Cache: | 1 MB I+D on chip per core |
| Tertiary Cache: | 39424 KB I+D on chip per chip |
| Other Cache: | None |
| Memory Amount (GB): | 192 |
| # and size of DIMM: | 12 x 16384 MB |
| Memory Details: | 12 x 16GB 2Rx8 PC4-2933Y-R; slots 1, 3, 5, 8, 10 and 12 populated in each socket |
| Power Supply Quantity and Rating (W): | None |
| Power Supply Details: | N/A |
| Disk Drive: | 1 x HPE 240GB 6G SATA M.2 SSD (875488-B21) |
| Disk Controller: | HPE Smart Array S100i SR Gen10 |
| # and type of Network Interface Cards (NICs) Installed: | 1 x HPE Synergy 3820C 10/20Gb CNA |
| NICs Enabled in Firmware / OS / Connected: | 2/2/1 |
| Network Speed (Mbit): | 1000 |
| Keyboard: | None |
| Mouse: | None |
| Monitor: | None |
| Optical Drives: | No |
| Other Hardware: | H/S: Standard |
| Software | |
|---|---|
| Power Management: | Enabled (see SUT Notes) |
| Operating System (OS): | Windows Server 2012 R2 Datacenter |
| OS Version: | Version 6.3 (Build 9600) |
| Filesystem: | NTFS |
| JVM Vendor: | Oracle Corporation |
| JVM Version: | Oracle Java HotSpot(TM) 64-Bit Server VM (build 24.80-b11, mixed mode), version 1.7.0_80 |
| JVM Command-line Options: | -server -Xmn21000m -Xms24000m -Xmx24000m -XX:SurvivorRatio=1 -XX:TargetSurvivorRatio=99 -XX:AllocatePrefetchDistance=256 -XX:AllocatePrefetchLines=4 -XX:LoopUnrollLimit=45 -XX:InitialTenuringThreshold=12 -XX:MaxTenuringThreshold=15 -XX:ParallelGCThreads=28 -XX:InlineSmallCode=3900 -XX:MaxInlineSize=270 -XX:FreqInlineSize=2500 -XX:+AggressiveOpts -XX:+UseLargePages -XX:+UseParallelOldGC |
| JVM Affinity: | start /NODE [0,1,2,3] /AFFINITY [0xFFFFFFF] |
| JVM Instances: | 4 |
| JVM Initial Heap (MB): | 21000 |
| JVM Maximum Heap (MB): | 21000 |
| JVM Address Bits: | 64 |
| Boot Firmware Version: | I42 v2.00 (02/02/2019) |
| Management Firmware Version: | 1.40 Feb 05 2019 |
| Workload Version: | SSJ 1.2.10 |
| Director Location: | Controller |
| Other Software: | HPE Service Pack for ProLiant (SPP) Version: 2019.03.0, Microsoft Windows KB4056898, KB4338815 |
| JVM Instance | ssj_ops@100% |
|---|---|
| NODE06.001 | 1,449,329 |
| NODE06.002 | 1,430,143 |
| NODE06.003 | 1,449,336 |
| NODE06.004 | 1,429,853 |
| ssj_ops@100% | 5,758,661 |
| ssj_ops@100% per JVM | 1,439,665 |

| Target Load | Actual Load | ssj_ops | |
|---|---|---|---|
| Target | Actual | ||
| Calibration 1 | 1,453,724 | ||
| Calibration 2 | 1,450,566 | ||
| Calibration 3 | 1,453,486 | ||
| ssj_ops@calibrated=1,452,026 | |||
| 100% | 99.8% | 1,452,026 | 1,449,329 |
| 90% | 90.0% | 1,306,823 | 1,306,183 |
| 80% | 79.8% | 1,161,621 | 1,158,599 |
| 70% | 70.0% | 1,016,418 | 1,016,683 |
| 60% | 60.1% | 871,216 | 872,372 |
| 50% | 49.9% | 726,013 | 724,877 |
| 40% | 40.2% | 580,810 | 584,345 |
| 30% | 30.1% | 435,608 | 437,429 |
| 20% | 19.9% | 290,405 | 289,455 |
| 10% | 10.0% | 145,203 | 144,786 |
| Active Idle | 0 | 0 | |

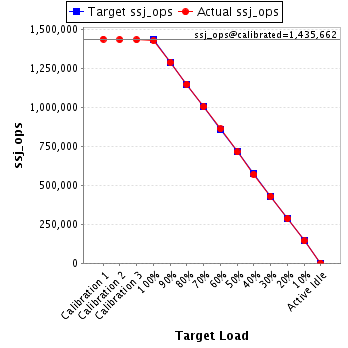
| Target Load | Actual Load | ssj_ops | |
|---|---|---|---|
| Target | Actual | ||
| Calibration 1 | 1,439,416 | ||
| Calibration 2 | 1,436,349 | ||
| Calibration 3 | 1,434,976 | ||
| ssj_ops@calibrated=1,435,662 | |||
| 100% | 99.6% | 1,435,662 | 1,430,143 |
| 90% | 89.9% | 1,292,096 | 1,290,935 |
| 80% | 80.0% | 1,148,530 | 1,148,954 |
| 70% | 70.0% | 1,004,964 | 1,005,251 |
| 60% | 60.1% | 861,397 | 862,731 |
| 50% | 49.8% | 717,831 | 714,790 |
| 40% | 39.8% | 574,265 | 571,162 |
| 30% | 30.0% | 430,699 | 430,199 |
| 20% | 19.9% | 287,132 | 285,854 |
| 10% | 10.0% | 143,566 | 144,180 |
| Active Idle | 0 | 0 | |
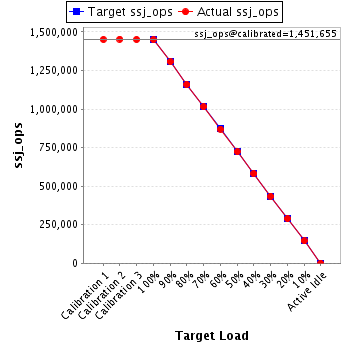
| Target Load | Actual Load | ssj_ops | |
|---|---|---|---|
| Target | Actual | ||
| Calibration 1 | 1,450,583 | ||
| Calibration 2 | 1,452,859 | ||
| Calibration 3 | 1,450,452 | ||
| ssj_ops@calibrated=1,451,655 | |||
| 100% | 99.8% | 1,451,655 | 1,449,336 |
| 90% | 90.0% | 1,306,490 | 1,306,752 |
| 80% | 79.8% | 1,161,324 | 1,159,002 |
| 70% | 69.9% | 1,016,159 | 1,014,637 |
| 60% | 60.0% | 870,993 | 870,411 |
| 50% | 49.8% | 725,828 | 722,885 |
| 40% | 40.0% | 580,662 | 580,174 |
| 30% | 30.0% | 435,497 | 435,442 |
| 20% | 19.9% | 290,331 | 288,879 |
| 10% | 10.0% | 145,166 | 144,876 |
| Active Idle | 0 | 0 | |
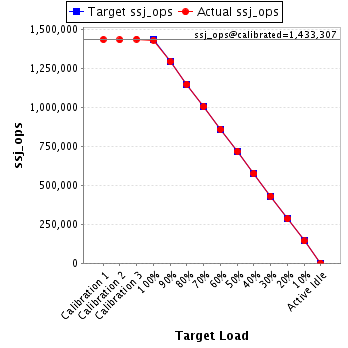
| Target Load | Actual Load | ssj_ops | |
|---|---|---|---|
| Target | Actual | ||
| Calibration 1 | 1,432,943 | ||
| Calibration 2 | 1,431,016 | ||
| Calibration 3 | 1,435,597 | ||
| ssj_ops@calibrated=1,433,307 | |||
| 100% | 99.8% | 1,433,307 | 1,429,853 |
| 90% | 90.1% | 1,289,976 | 1,291,609 |
| 80% | 80.0% | 1,146,646 | 1,146,115 |
| 70% | 70.0% | 1,003,315 | 1,003,327 |
| 60% | 59.8% | 859,984 | 857,772 |
| 50% | 50.0% | 716,653 | 716,865 |
| 40% | 40.0% | 573,323 | 573,559 |
| 30% | 30.1% | 429,992 | 430,866 |
| 20% | 19.9% | 286,661 | 284,724 |
| 10% | 10.0% | 143,331 | 142,793 |
| Active Idle | 0 | 0 | |