
SPECpower_ssj2008
Host 'NODE05' Performance Report
Copyright © 2007-2019 Standard Performance Evaluation Corporation
| Hewlett Packard Enterprise Synergy 480 Gen10 Compute Module | ssj_ops@100% = 5,784,516 ssj_ops@100% per JVM = 1,446,129 |
||||
| Test Sponsor: | Hewlett Packard Enterprise | SPEC License #: | 3 | Test Method: | Multi Node |
| Tested By: | Hewlett Packard Enterprise | Test Location: | Houston, TX, USA | Test Date: | Mar 26, 2019 |
| Hardware Availability: | Apr-2019 | Software Availability: | Mar-2019 | Publication: | May 8, 2019 |
| System Source: | Single Supplier | System Designation: | Server | Power Provisioning: | Line-powered |
| Target Load | Actual Load | ssj_ops | |
|---|---|---|---|
| Target | Actual | ||
| Calibration 1 | 5,802,901 | ||
| Calibration 2 | 5,799,177 | ||
| Calibration 3 | 5,804,492 | ||
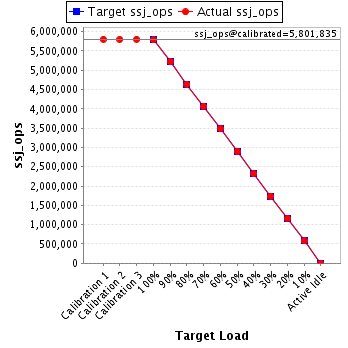
| ssj_ops@calibrated=5,801,835 | |||
| 100% | 99.7% | 5,801,835 | 5,784,516 |
| 90% | 90.0% | 5,221,651 | 5,218,956 |
| 80% | 80.0% | 4,641,468 | 4,640,960 |
| 70% | 70.1% | 4,061,284 | 4,066,157 |
| 60% | 60.0% | 3,481,101 | 3,480,213 |
| 50% | 50.0% | 2,900,917 | 2,898,898 |
| 40% | 40.0% | 2,320,734 | 2,319,145 |
| 30% | 30.0% | 1,740,550 | 1,741,744 |
| 20% | 20.0% | 1,160,367 | 1,160,251 |
| 10% | 10.0% | 580,183 | 579,101 |
| Active Idle | 0 | 0 | |
| Set Identifier: | SUT |
| Set Description: | System Under Test |
| # of Identical Nodes: | 9 |
| Comment: | SUT |
| Hardware | |
|---|---|
| Hardware Vendor: | Hewlett Packard Enterprise |
| Model: | Synergy 480 Gen10 Compute Module |
| Form Factor: | 7U |
| CPU Name: | Intel Xeon Platinum 8280 @ 2.70GHz (Intel Turbo Boost Technology up to 4.00 GHz) |
| CPU Characteristics: | 28-Core, 2.70 GHz, 38.5MB L3 Cache |
| CPU Frequency (MHz): | 2700 |
| CPU(s) Enabled: | 56 cores, 2 chips, 28 cores/chip |
| Hardware Threads: | 112 (2 / core) |
| CPU(s) Orderable: | 1,2 chips |
| Primary Cache: | 32 KB I + 32 KB D on chip per core |
| Secondary Cache: | 1 MB I+D on chip per core |
| Tertiary Cache: | 39424 KB I+D on chip per chip |
| Other Cache: | None |
| Memory Amount (GB): | 192 |
| # and size of DIMM: | 12 x 16384 MB |
| Memory Details: | 12 x 16GB 2Rx8 PC4-2933Y-R; slots 1, 3, 5, 8, 10 and 12 populated in each socket |
| Power Supply Quantity and Rating (W): | None |
| Power Supply Details: | N/A |
| Disk Drive: | 1 x HPE 240GB 6G SATA M.2 SSD (875488-B21) |
| Disk Controller: | HPE Smart Array S100i SR Gen10 |
| # and type of Network Interface Cards (NICs) Installed: | 1 x HPE Synergy 3820C 10/20Gb CNA |
| NICs Enabled in Firmware / OS / Connected: | 2/2/1 |
| Network Speed (Mbit): | 1000 |
| Keyboard: | None |
| Mouse: | None |
| Monitor: | None |
| Optical Drives: | No |
| Other Hardware: | H/S: Standard |
| Software | |
|---|---|
| Power Management: | Enabled (see SUT Notes) |
| Operating System (OS): | Windows Server 2012 R2 Datacenter |
| OS Version: | Version 6.3 (Build 9600) |
| Filesystem: | NTFS |
| JVM Vendor: | Oracle Corporation |
| JVM Version: | Oracle Java HotSpot(TM) 64-Bit Server VM (build 24.80-b11, mixed mode), version 1.7.0_80 |
| JVM Command-line Options: | -server -Xmn21000m -Xms24000m -Xmx24000m -XX:SurvivorRatio=1 -XX:TargetSurvivorRatio=99 -XX:AllocatePrefetchDistance=256 -XX:AllocatePrefetchLines=4 -XX:LoopUnrollLimit=45 -XX:InitialTenuringThreshold=12 -XX:MaxTenuringThreshold=15 -XX:ParallelGCThreads=28 -XX:InlineSmallCode=3900 -XX:MaxInlineSize=270 -XX:FreqInlineSize=2500 -XX:+AggressiveOpts -XX:+UseLargePages -XX:+UseParallelOldGC |
| JVM Affinity: | start /NODE [0,1,2,3] /AFFINITY [0xFFFFFFF] |
| JVM Instances: | 4 |
| JVM Initial Heap (MB): | 24000 |
| JVM Maximum Heap (MB): | 24000 |
| JVM Address Bits: | 64 |
| Boot Firmware Version: | I42 v2.00 (02/02/2019) |
| Management Firmware Version: | 1.40 Feb 05 2019 |
| Workload Version: | SSJ 1.2.10 |
| Director Location: | Controller |
| Other Software: | HPE Service Pack for ProLiant (SPP) Version: 2019.03.0, Microsoft Windows KB4056898, KB4338815 |
| JVM Instance | ssj_ops@100% |
|---|---|
| NODE05.001 | 1,432,026 |
| NODE05.002 | 1,440,933 |
| NODE05.003 | 1,460,682 |
| NODE05.004 | 1,450,874 |
| ssj_ops@100% | 5,784,516 |
| ssj_ops@100% per JVM | 1,446,129 |

| Target Load | Actual Load | ssj_ops | |
|---|---|---|---|
| Target | Actual | ||
| Calibration 1 | 1,434,911 | ||
| Calibration 2 | 1,437,647 | ||
| Calibration 3 | 1,437,541 | ||
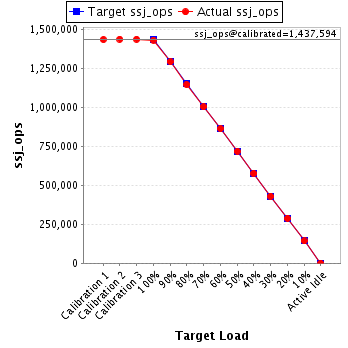
| ssj_ops@calibrated=1,437,594 | |||
| 100% | 99.6% | 1,437,594 | 1,432,026 |
| 90% | 89.9% | 1,293,835 | 1,292,531 |
| 80% | 79.7% | 1,150,075 | 1,146,381 |
| 70% | 69.8% | 1,006,316 | 1,003,669 |
| 60% | 60.0% | 862,556 | 863,038 |
| 50% | 50.0% | 718,797 | 718,564 |
| 40% | 40.1% | 575,038 | 576,033 |
| 30% | 29.9% | 431,278 | 430,439 |
| 20% | 20.1% | 287,519 | 288,626 |
| 10% | 9.9% | 143,759 | 142,953 |
| Active Idle | 0 | 0 | |
| Target Load | Actual Load | ssj_ops | |
|---|---|---|---|
| Target | Actual | ||
| Calibration 1 | 1,449,586 | ||
| Calibration 2 | 1,444,117 | ||
| Calibration 3 | 1,445,657 | ||
| ssj_ops@calibrated=1,444,887 | |||
| 100% | 99.7% | 1,444,887 | 1,440,933 |
| 90% | 90.1% | 1,300,398 | 1,302,154 |
| 80% | 79.9% | 1,155,909 | 1,154,945 |
| 70% | 70.3% | 1,011,421 | 1,015,558 |
| 60% | 60.0% | 866,932 | 867,628 |
| 50% | 50.0% | 722,443 | 722,412 |
| 40% | 39.9% | 577,955 | 577,010 |
| 30% | 30.1% | 433,466 | 435,281 |
| 20% | 19.9% | 288,977 | 287,768 |
| 10% | 10.0% | 144,489 | 145,113 |
| Active Idle | 0 | 0 | |

| Target Load | Actual Load | ssj_ops | |
|---|---|---|---|
| Target | Actual | ||
| Calibration 1 | 1,461,097 | ||
| Calibration 2 | 1,462,217 | ||
| Calibration 3 | 1,464,431 | ||
| ssj_ops@calibrated=1,463,324 | |||
| 100% | 99.8% | 1,463,324 | 1,460,682 |
| 90% | 90.0% | 1,316,991 | 1,316,427 |
| 80% | 80.0% | 1,170,659 | 1,170,852 |
| 70% | 70.0% | 1,024,327 | 1,024,149 |
| 60% | 60.0% | 877,994 | 878,556 |
| 50% | 50.1% | 731,662 | 732,925 |
| 40% | 39.8% | 585,329 | 582,901 |
| 30% | 30.0% | 438,997 | 439,527 |
| 20% | 20.0% | 292,665 | 292,031 |
| 10% | 10.0% | 146,332 | 145,773 |
| Active Idle | 0 | 0 | |

| Target Load | Actual Load | ssj_ops | |
|---|---|---|---|
| Target | Actual | ||
| Calibration 1 | 1,457,307 | ||
| Calibration 2 | 1,455,196 | ||
| Calibration 3 | 1,456,864 | ||
| ssj_ops@calibrated=1,456,030 | |||
| 100% | 99.6% | 1,456,030 | 1,450,874 |
| 90% | 89.8% | 1,310,427 | 1,307,844 |
| 80% | 80.3% | 1,164,824 | 1,168,782 |
| 70% | 70.2% | 1,019,221 | 1,022,782 |
| 60% | 59.8% | 873,618 | 870,991 |
| 50% | 49.8% | 728,015 | 724,996 |
| 40% | 40.1% | 582,412 | 583,202 |
| 30% | 30.0% | 436,809 | 436,497 |
| 20% | 20.0% | 291,206 | 291,826 |
| 10% | 10.0% | 145,603 | 145,261 |
| Active Idle | 0 | 0 | |
