SPECpower_ssj2008
Host 'NODE05' Performance Report
Copyright © 2007-2019 Standard Performance Evaluation Corporation
| Hewlett Packard Enterprise Synergy 480 Gen10 Compute Module | ssj_ops@100% = 5,791,586 ssj_ops@100% per JVM = 1,447,897 |
||||
| Test Sponsor: | Hewlett Packard Enterprise | SPEC License #: | 3 | Test Method: | Multi Node |
| Tested By: | Hewlett Packard Enterprise | Test Location: | Houston, TX, USA | Test Date: | Mar 26, 2019 |
| Hardware Availability: | Apr-2019 | Software Availability: | Mar-2019 | Publication: | May 8, 2019 |
| System Source: | Single Supplier | System Designation: | Server | Power Provisioning: | Line-powered |
| Target Load | Actual Load | ssj_ops | |
|---|---|---|---|
| Target | Actual | ||
| Calibration 1 | 5,814,704 | ||
| Calibration 2 | 5,811,134 | ||
| Calibration 3 | 5,814,396 | ||
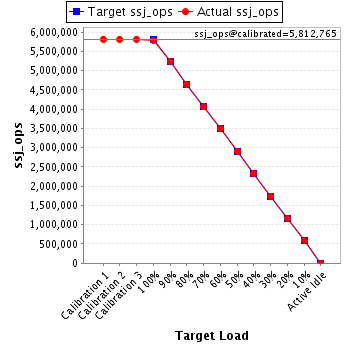
| ssj_ops@calibrated=5,812,765 | |||
| 100% | 99.6% | 5,812,765 | 5,791,586 |
| 90% | 90.1% | 5,231,488 | 5,237,921 |
| 80% | 80.0% | 4,650,212 | 4,648,163 |
| 70% | 69.9% | 4,068,935 | 4,062,140 |
| 60% | 59.9% | 3,487,659 | 3,484,352 |
| 50% | 50.1% | 2,906,382 | 2,909,712 |
| 40% | 40.0% | 2,325,106 | 2,325,676 |
| 30% | 30.0% | 1,743,829 | 1,743,928 |
| 20% | 20.0% | 1,162,553 | 1,160,924 |
| 10% | 10.0% | 581,276 | 582,832 |
| Active Idle | 0 | 0 | |
| Set Identifier: | SUT |
| Set Description: | System Under Test |
| # of Identical Nodes: | 10 |
| Comment: | SUT |
| Hardware | |
|---|---|
| Hardware Vendor: | Hewlett Packard Enterprise |
| Model: | Synergy 480 Gen10 Compute Module |
| Form Factor: | 7U |
| CPU Name: | Intel Xeon Platinum 8280 @ 2.70GHz (Intel Turbo Boost Technology up to 4.00 GHz) |
| CPU Characteristics: | 28-Core, 2.70 GHz, 38.5MB L3 Cache |
| CPU Frequency (MHz): | 2700 |
| CPU(s) Enabled: | 56 cores, 2 chips, 28 cores/chip |
| Hardware Threads: | 112 (2 / core) |
| CPU(s) Orderable: | 1,2 chips |
| Primary Cache: | 32 KB I + 32 KB D on chip per core |
| Secondary Cache: | 1 MB I+D on chip per core |
| Tertiary Cache: | 39424 KB I+D on chip per chip |
| Other Cache: | None |
| Memory Amount (GB): | 192 |
| # and size of DIMM: | 12 x 16384 MB |
| Memory Details: | 12 x 16GB 2Rx8 PC4-2933Y-R; slots 1, 3, 5, 8, 10 and 12 populated in each socket |
| Power Supply Quantity and Rating (W): | None |
| Power Supply Details: | N/A |
| Disk Drive: | 1 x HPE 240GB 6G SATA M.2 SSD (875488-B21) |
| Disk Controller: | HPE Smart Array S100i SR Gen10 |
| # and type of Network Interface Cards (NICs) Installed: | 1 x HPE Synergy 3820C 10/20Gb CNA |
| NICs Enabled in Firmware / OS / Connected: | 2/2/1 |
| Network Speed (Mbit): | 1000 |
| Keyboard: | None |
| Mouse: | None |
| Monitor: | None |
| Optical Drives: | No |
| Other Hardware: | H/S: Standard |
| Software | |
|---|---|
| Power Management: | Enabled (see SUT Notes) |
| Operating System (OS): | Windows Server 2012 R2 Datacenter |
| OS Version: | Version 6.3 (Build 9600) |
| Filesystem: | NTFS |
| JVM Vendor: | Oracle Corporation |
| JVM Version: | Oracle Java HotSpot(TM) 64-Bit Server VM (build 24.80-b11, mixed mode), version 1.7.0_80 |
| JVM Command-line Options: | -server -Xmn21000m -Xms24000m -Xmx24000m -XX:SurvivorRatio=1 -XX:TargetSurvivorRatio=99 -XX:AllocatePrefetchDistance=256 -XX:AllocatePrefetchLines=4 -XX:LoopUnrollLimit=45 -XX:InitialTenuringThreshold=12 -XX:MaxTenuringThreshold=15 -XX:ParallelGCThreads=28 -XX:InlineSmallCode=3900 -XX:MaxInlineSize=270 -XX:FreqInlineSize=2500 -XX:+AggressiveOpts -XX:+UseLargePages -XX:+UseParallelOldGC |
| JVM Affinity: | start /NODE [0,1,2,3] /AFFINITY [0xFFFFFFF] |
| JVM Instances: | 4 |
| JVM Initial Heap (MB): | 24000 |
| JVM Maximum Heap (MB): | 24000 |
| JVM Address Bits: | 64 |
| Boot Firmware Version: | I42 v2.00 (02/02/2019) |
| Management Firmware Version: | 1.40 Feb 05 2019 |
| Workload Version: | SSJ 1.2.10 |
| Director Location: | Controller |
| Other Software: | HPE Service Pack for ProLiant (SPP) Version: 2019.03.0, Microsoft Windows KB4056898, KB4338815 |
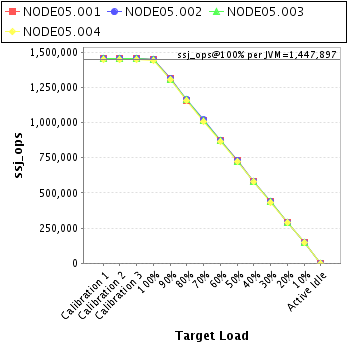
| JVM Instance | ssj_ops@100% |
|---|---|
| NODE05.001 | 1,450,175 |
| NODE05.002 | 1,450,995 |
| NODE05.003 | 1,446,821 |
| NODE05.004 | 1,443,595 |
| ssj_ops@100% | 5,791,586 |
| ssj_ops@100% per JVM | 1,447,897 |
| Target Load | Actual Load | ssj_ops | |
|---|---|---|---|
| Target | Actual | ||
| Calibration 1 | 1,455,853 | ||
| Calibration 2 | 1,453,847 | ||
| Calibration 3 | 1,455,833 | ||
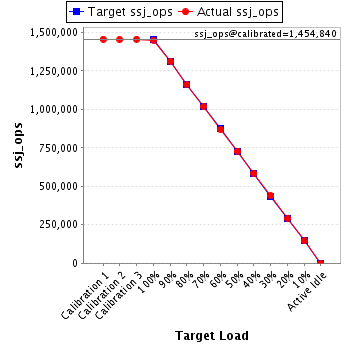
| ssj_ops@calibrated=1,454,840 | |||
| 100% | 99.7% | 1,454,840 | 1,450,175 |
| 90% | 90.2% | 1,309,356 | 1,312,500 |
| 80% | 79.7% | 1,163,872 | 1,160,129 |
| 70% | 70.0% | 1,018,388 | 1,018,337 |
| 60% | 59.8% | 872,904 | 870,084 |
| 50% | 50.1% | 727,420 | 728,232 |
| 40% | 40.0% | 581,936 | 582,430 |
| 30% | 30.1% | 436,452 | 437,914 |
| 20% | 20.0% | 290,968 | 291,623 |
| 10% | 10.0% | 145,484 | 144,841 |
| Active Idle | 0 | 0 | |
| Target Load | Actual Load | ssj_ops | |
|---|---|---|---|
| Target | Actual | ||
| Calibration 1 | 1,455,905 | ||
| Calibration 2 | 1,456,875 | ||
| Calibration 3 | 1,458,087 | ||
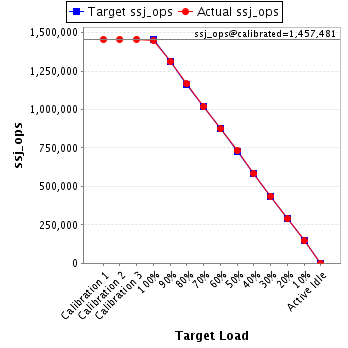
| ssj_ops@calibrated=1,457,481 | |||
| 100% | 99.6% | 1,457,481 | 1,450,995 |
| 90% | 90.1% | 1,311,733 | 1,313,071 |
| 80% | 80.1% | 1,165,985 | 1,167,312 |
| 70% | 69.9% | 1,020,237 | 1,019,262 |
| 60% | 60.0% | 874,489 | 873,992 |
| 50% | 50.2% | 728,741 | 731,440 |
| 40% | 40.0% | 582,992 | 583,374 |
| 30% | 30.0% | 437,244 | 437,378 |
| 20% | 19.8% | 291,496 | 288,542 |
| 10% | 10.1% | 145,748 | 146,628 |
| Active Idle | 0 | 0 | |
| Target Load | Actual Load | ssj_ops | |
|---|---|---|---|
| Target | Actual | ||
| Calibration 1 | 1,452,433 | ||
| Calibration 2 | 1,453,546 | ||
| Calibration 3 | 1,452,655 | ||
| ssj_ops@calibrated=1,453,101 | |||
| 100% | 99.6% | 1,453,101 | 1,446,821 |
| 90% | 90.0% | 1,307,791 | 1,308,025 |
| 80% | 80.0% | 1,162,480 | 1,163,135 |
| 70% | 69.9% | 1,017,170 | 1,016,315 |
| 60% | 60.0% | 871,860 | 871,808 |
| 50% | 50.0% | 726,550 | 725,860 |
| 40% | 40.0% | 581,240 | 581,961 |
| 30% | 30.0% | 435,930 | 435,769 |
| 20% | 20.0% | 290,620 | 290,530 |
| 10% | 10.0% | 145,310 | 145,024 |
| Active Idle | 0 | 0 | |

| Target Load | Actual Load | ssj_ops | |
|---|---|---|---|
| Target | Actual | ||
| Calibration 1 | 1,450,514 | ||
| Calibration 2 | 1,446,866 | ||
| Calibration 3 | 1,447,821 | ||
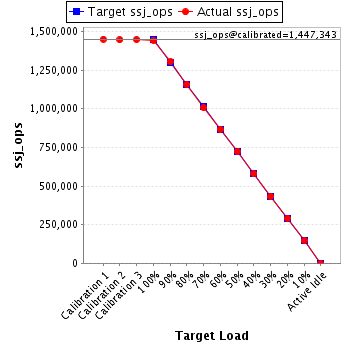
| ssj_ops@calibrated=1,447,343 | |||
| 100% | 99.7% | 1,447,343 | 1,443,595 |
| 90% | 90.1% | 1,302,609 | 1,304,325 |
| 80% | 80.0% | 1,157,875 | 1,157,586 |
| 70% | 69.7% | 1,013,140 | 1,008,226 |
| 60% | 60.0% | 868,406 | 868,468 |
| 50% | 50.0% | 723,672 | 724,180 |
| 40% | 39.9% | 578,937 | 577,910 |
| 30% | 29.9% | 434,203 | 432,866 |
| 20% | 20.1% | 289,469 | 290,229 |
| 10% | 10.1% | 144,734 | 146,339 |
| Active Idle | 0 | 0 | |